HEALTH RANKINGS Missouri

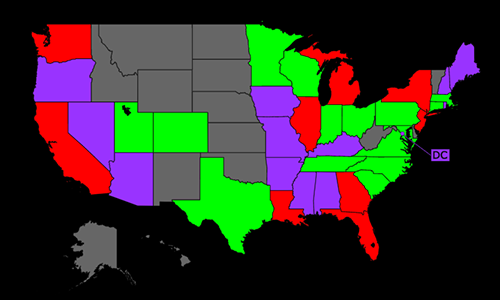
AGE-STANDARDIZED DEATH RATE: CDC 12/22
PER 100,000 POPULATION
GOOD
POOR
| CAUSES OF DEATH | Rate | USA Rank | |
| 1. | Coronary Heart Disease |
106.51
|
11
|
| 2. | COVID-19 |
100.48
|
26
|
| 3. | Lung Disease |
43.86
|
10
|
| 4. | Lung Cancers |
41.86
|
8
|
| 5. | Stroke |
40.97
|
27
|
| 6. | Poisonings |
35.49
|
21
|
| 7. | Alzheimers |
33.04
|
22
|
| 8. | Hypertension |
24.70
|
35
|
| 9. | Diabetes Mellitus |
24.03
|
33
|
| 10. | Breast Cancer |
20.58
|
15
|
| 11. | Kidney Disease |
20.34
|
7
|
| 12. | Suicide |
18.72
|
19
|
| 13. | Prostate Cancer |
17.28
|
46
|
| 14. | Colon-Rectum Cancers |
15.14
|
10
|
| 15. | Endocrine Disorders |
14.31
|
37
|
| 16. | Liver Disease |
12.96
|
36
|
| 17. | Homicide |
12.38
|
7
|
| 18. | Pancreas Cancer |
12.18
|
11
|
| 19. | Influenza & Pneumonia |
11.51
|
14
|
| 20. | Falls |
11.27
|
34
|
| CAUSES OF DEATH | Rate | USA Rank | |
| 21. | Parkinson's Disease |
10.56
|
18
|
| 22. | Lymphomas |
8.51
|
31
|
| 23. | Inflammatory/Heart |
7.13
|
28
|
| 24. | Liver Cancer |
6.73
|
22
|
| 25. | Leukemia |
6.39
|
14
|
| 26. | Alcohol |
5.16
|
24
|
| 27. | Ovary Cancer |
5.14
|
47
|
| 28. | Other Neoplasms |
5.11
|
6
|
| 29. | Uterin Cancer |
4.93
|
33
|
| 30. | Oesophagus Cancer |
4.81
|
8
|
| 31. | Bladder Cancer |
4.53
|
17
|
| 32. | Skin Cancers |
3.25
|
28
|
| 33. | Oral Cancer |
3.01
|
19
|
| 34. | Congenital Anomalies |
3.00
|
38
|
| 35. | Cervical Cancer |
2.63
|
15
|
| 36. | Stomach Cancer |
2.07
|
45
|
| 37. | Drownings |
1.69
|
11
|
| 38. | Low Birth Weight |
1.43
|
22
|
| 39. | Drug Use |
1.13
|
19
|
| 40. | HIV/AIDS |
0.90
|
22
|

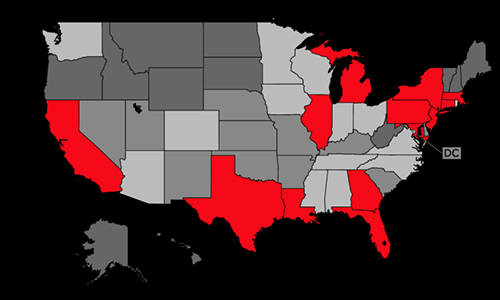
PERCENT TOP 50 CAUSES: CDC 12/22
| CAUSES OF DEATH | Deaths | % | |
| 1. | Coronary Heart Disease |
8,359
|
15.33
|
| 2. | COVID-19 |
7,758
|
14.23
|
| 3. | Lung Disease |
3,534
|
6.48
|
| 4. | Lung Cancers |
3,463
|
6.35
|
| 5. | Stroke |
3,172
|
5.82
|
| 6. | Alzheimers |
2,514
|
4.61
|
| 7. | Poisonings |
2,078
|
3.81
|
| 8. | Hypertension |
1,893
|
3.47
|
| 9. | Diabetes Mellitus |
1,871
|
3.43
|
| 10. | Kidney Disease |
1,573
|
2.89
|
| 11. | Suicide |
1,177
|
2.16
|
| 12. | Colon-Rectum Cancers |
1,161
|
2.13
|
| 13. | Endocrine Disorders |
1,076
|
1.97
|
| 14. | Road Traffic Accidents |
1,013
|
1.86
|
| 15. | Pancreas Cancer |
990
|
1.82
|
| 16. | Liver Disease |
954
|
1.75
|
| 17. | Breast Cancer |
877
|
1.61
|
| 18. | Influenza & Pneumonia |
876
|
1.61
|
| 19. | Falls |
851
|
1.56
|
| 20. | Parkinson's Disease |
799
|
1.47
|
| 21. | Other Injuries |
752
|
1.38
|
| 22. | Homicide |
700
|
1.28
|
| 23. | Lymphomas |
654
|
1.20
|
| 24. | Prostate Cancer |
573
|
1.05
|
| 25. | Liver Cancer |
549
|
1.01
|
| CAUSES OF DEATH | Deaths | % | |
| 26. | Inflammatory/Heart |
520
|
0.95
|
| 27. | Malnutrition |
518
|
0.95
|
| 28. | Leukemia |
485
|
0.89
|
| 29. | Other Neoplasms |
390
|
0.72
|
| 30. | Oesophagus Cancer |
387
|
0.71
|
| 31. | Alcohol |
355
|
0.65
|
| 32. | Bladder Cancer |
351
|
0.64
|
| 33. | Skin Cancers |
245
|
0.45
|
| 34. | Oral Cancer |
239
|
0.44
|
| 35. | Ovary Cancer |
210
|
0.39
|
| 36. | Uterin Cancer |
194
|
0.36
|
| 37. | Stomach Cancer |
157
|
0.29
|
| 38. | Diarrhoeal diseases |
139
|
0.25
|
| 39. | Congenital Anomalies |
137
|
0.25
|
| 40. | Skin Disease |
125
|
0.23
|
| 41. | Multiple Sclerosis |
81
|
0.15
|
| 42. | Cervical Cancer |
77
|
0.14
|
| 43. | Drownings |
72
|
0.13
|
| 44. | Low Birth Weight |
69
|
0.13
|
| 45. | Anaemia |
67
|
0.12
|
| 46. | Rheumatic/Heart |
66
|
0.12
|
| 47. | Fires |
63
|
0.12
|
| 48. | Epilepsy |
52
|
0.10
|
| 49. | Drug Use |
50
|
0.09
|
| 50. | HIV/AIDS |
42
|
0.08
|

AGE-STANDARDIZED DEATH RATE: CDC 12/22
PER 100,000 POPULATION
GOOD
POOR
| Rate | USA Rank | ||
| 1. | Lung Cancers |
41.86
|
8
|
| 2. | Breast Cancer |
20.58
|
15
|
| 3. | Prostate Cancer |
17.28
|
46
|
| 4. | Colon-Rectum Cancers |
15.14
|
10
|
| 5. | Pancreas Cancer |
12.18
|
11
|
| 6. | Lymphomas |
8.51
|
31
|
| 7. | Liver Cancer |
6.73
|
22
|
| 8. | Leukemia |
6.39
|
14
|
| Rate | USA Rank | ||
| 9. | Ovary Cancer |
5.14
|
47
|
| 10. | Uterin Cancer |
4.93
|
33
|
| 11. | Oesophagus Cancer |
4.81
|
8
|
| 12. | Bladder Cancer |
4.53
|
17
|
| 13. | Skin Cancers |
3.25
|
28
|
| 14. | Oral Cancer |
3.01
|
19
|
| 15. | Cervical Cancer |
2.63
|
15
|
| 16. | Stomach Cancer |
2.07
|
45
|
DEATH RATE HISTORY SELECTED CAUSES

| Date | Rate | Total | Population |
| 1999 | 300.46 | 17,974 | 5,561,948 |
| 2000 | 286.00 | 17,235 | 5,595,211 |
| 2001 | 273.42 | 16,633 | 5,641,142 |
| 2002 | 272.67 | 16,708 | 5,674,825 |
| 2003 | 264.89 | 16,410 | 5,709,403 |
| 2004 | 248.51 | 15,500 | 5,747,741 |
| 2005 | 236.75 | 14,974 | 5,790,300 |
| 2006 | 228.81 | 14,749 | 5,842,704 |
| 2007 | 218.94 | 14,338 | 5,887,612 |
| 2008 | 219.79 | 14,644 | 5,923,916 |
| 2009 | 206.14 | 13,916 | 5,961,088 |
| 2010 | 201.77 | 13,840 | 5,988,927 |
| 2011 | 197.37 | 13,810 | 6,010,688 |
| 2012 | 193.37 | 13,742 | 6,021,988 |
| 2013 | 194.70 | 14,095 | 6,044,171 |
| 2014 | 194.71 | 14,338 | 6,063,589 |
| 2015 | 197.94 | 14,808 | 6,083,672 |
| 2016 | 192.10 | 14,579 | 6,093,000 |
| 2017 | 191.12 | 14,820 | 6,113,532 |
| 2018 | 188.42 | 14,893 | 6,126,452 |
| 2019 | 186.97 | 15,018 | 6,137,428 |
| 2020 | 196.68 | 15,934 | 6,151,548 |
| 2021 | 202.42 | 15,713 | 6,168,187 |

| Date | Rate | Total | Population |
| 1999 | 207.90 | 12,186 | 5,561,948 |
| 2000 | 205.86 | 12,144 | 5,595,211 |
| 2001 | 207.08 | 12,365 | 5,641,142 |
| 2002 | 204.10 | 12,322 | 5,674,825 |
| 2003 | 202.05 | 12,354 | 5,709,403 |
| 2004 | 201.11 | 12,450 | 5,747,741 |
| 2005 | 197.98 | 12,419 | 5,790,300 |
| 2006 | 195.82 | 12,519 | 5,842,704 |
| 2007 | 190.89 | 12,380 | 5,887,612 |
| 2008 | 189.49 | 12,523 | 5,923,916 |
| 2009 | 185.70 | 12,472 | 5,961,088 |
| 2010 | 185.57 | 12,626 | 5,988,927 |
| 2011 | 179.36 | 12,473 | 6,010,688 |
| 2012 | 182.33 | 12,919 | 6,021,988 |
| 2013 | 179.40 | 12,955 | 6,044,171 |
| 2014 | 177.75 | 13,067 | 6,063,589 |
| 2015 | 173.35 | 12,965 | 6,083,672 |
| 2016 | 166.98 | 12,696 | 6,093,000 |
| 2017 | 167.25 | 12,971 | 6,113,532 |
| 2018 | 165.27 | 13,040 | 6,126,452 |
| 2019 | 159.71 | 12,873 | 6,137,428 |
| 2020 | 157.86 | 12,907 | 6,151,548 |
| 2021 | 164.15 | 13,153 | 6,168,187 |

| Date | Rate | Total | Population |
| 1999 | 65.61 | 3,950 | 5,561,948 |
| 2000 | 65.09 | 3,940 | 5,595,211 |
| 2001 | 62.04 | 3,796 | 5,641,142 |
| 2002 | 63.14 | 3,885 | 5,674,825 |
| 2003 | 57.72 | 3,580 | 5,709,403 |
| 2004 | 56.07 | 3,503 | 5,747,741 |
| 2005 | 52.85 | 3,347 | 5,790,300 |
| 2006 | 50.53 | 3,247 | 5,842,704 |
| 2007 | 49.43 | 3,229 | 5,887,612 |
| 2008 | 49.16 | 3,261 | 5,923,916 |
| 2009 | 44.88 | 3,017 | 5,961,088 |
| 2010 | 43.96 | 3,001 | 5,988,927 |
| 2011 | 43.44 | 3,033 | 6,010,688 |
| 2012 | 42.22 | 2,989 | 6,021,988 |
| 2013 | 40.63 | 2,935 | 6,044,171 |
| 2014 | 41.02 | 3,030 | 6,063,589 |
| 2015 | 40.81 | 3,037 | 6,083,672 |
| 2016 | 40.42 | 3,069 | 6,093,000 |
| 2017 | 41.01 | 3,159 | 6,113,532 |
| 2018 | 38.49 | 3,039 | 6,126,452 |
| 2019 | 37.73 | 3,031 | 6,137,428 |
| 2020 | 40.30 | 3,275 | 6,151,548 |
| 2021 | 40.97 | 3,178 | 6,168,187 |

| Date | Rate | Total | Population |
| 1999 | 51.66 | 3,068 | 5,561,948 |
| 2000 | 46.91 | 2,802 | 5,595,211 |
| 2001 | 47.79 | 2,882 | 5,641,142 |
| 2002 | 47.15 | 2,867 | 5,674,825 |
| 2003 | 47.88 | 2,939 | 5,709,403 |
| 2004 | 44.06 | 2,731 | 5,747,741 |
| 2005 | 49.23 | 3,085 | 5,790,300 |
| 2006 | 47.43 | 3,017 | 5,842,704 |
| 2007 | 47.58 | 3,081 | 5,887,612 |
| 2008 | 57.38 | 3,765 | 5,923,916 |
| 2009 | 51.91 | 3,456 | 5,961,088 |
| 2010 | 52.56 | 3,557 | 5,988,927 |
| 2011 | 50.54 | 3,492 | 6,010,688 |
| 2012 | 51.68 | 3,650 | 6,021,988 |
| 2013 | 52.88 | 3,798 | 6,044,171 |
| 2014 | 51.37 | 3,762 | 6,063,589 |
| 2015 | 52.83 | 3,935 | 6,083,672 |
| 2016 | 52.08 | 3,961 | 6,093,000 |
| 2017 | 50.66 | 3,940 | 6,113,532 |
| 2018 | 50.16 | 3,978 | 6,126,452 |
| 2019 | 46.68 | 3,790 | 6,137,428 |
| 2020 | 46.99 | 3,876 | 6,151,548 |
| 2021 | 45.21 | 3,626 | 6,168,187 |

| Date | Rate | Total | Population |
| 1999 | 43.22 | 2,465 | 5,561,948 |
| 2000 | 41.90 | 2,398 | 5,595,211 |
| 2001 | 42.47 | 2,455 | 5,641,142 |
| 2002 | 45.55 | 2,641 | 5,674,825 |
| 2003 | 47.56 | 2,786 | 5,709,403 |
| 2004 | 46.40 | 2,728 | 5,747,741 |
| 2005 | 47.82 | 2,848 | 5,790,300 |
| 2006 | 50.08 | 3,009 | 5,842,704 |
| 2007 | 48.79 | 2,975 | 5,887,612 |
| 2008 | 48.93 | 2,997 | 5,923,916 |
| 2009 | 47.51 | 2,939 | 5,961,088 |
| 2010 | 47.94 | 2,975 | 5,988,927 |
| 2011 | 50.53 | 3,169 | 6,010,688 |
| 2012 | 47.84 | 3,002 | 6,021,988 |
| 2013 | 47.02 | 2,981 | 6,044,171 |
| 2014 | 48.65 | 3,110 | 6,063,589 |
| 2015 | 50.88 | 3,309 | 6,083,672 |
| 2016 | 56.99 | 3,625 | 6,093,000 |
| 2017 | 58.79 | 3,776 | 6,113,532 |
| 2018 | 61.63 | 3,975 | 6,126,452 |
| 2019 | 60.99 | 3,950 | 6,137,428 |
| 2020 | 68.39 | 4,418 | 6,151,548 |
| 2021 | 75.15 | 4,814 | 6,168,187 |

| Date | Rate | Total | Population |
| 1999 | 26.34 | 1,554 | 5,561,948 |
| 2000 | 24.60 | 1,458 | 5,595,211 |
| 2001 | 25.60 | 1,535 | 5,641,142 |
| 2002 | 26.75 | 1,625 | 5,674,825 |
| 2003 | 27.14 | 1,666 | 5,709,403 |
| 2004 | 23.59 | 1,461 | 5,747,741 |
| 2005 | 24.76 | 1,549 | 5,790,300 |
| 2006 | 23.48 | 1,493 | 5,842,704 |
| 2007 | 22.35 | 1,444 | 5,887,612 |
| 2008 | 20.44 | 1,348 | 5,923,916 |
| 2009 | 19.84 | 1,335 | 5,961,088 |
| 2010 | 21.15 | 1,425 | 5,988,927 |
| 2011 | 20.83 | 1,438 | 6,010,688 |
| 2012 | 19.62 | 1,377 | 6,021,988 |
| 2013 | 20.50 | 1,477 | 6,044,171 |
| 2014 | 19.41 | 1,423 | 6,063,589 |
| 2015 | 19.69 | 1,468 | 6,083,672 |
| 2016 | 20.07 | 1,508 | 6,093,000 |
| 2017 | 20.98 | 1,605 | 6,113,532 |
| 2018 | 20.77 | 1,606 | 6,126,452 |
| 2019 | 20.91 | 1,658 | 6,137,428 |
| 2020 | 23.08 | 1,844 | 6,151,548 |
| 2021 | 24.03 | 1,876 | 6,168,187 |

| Date | Rate | Total | Population |
| 1999 | 14.99 | 914 | 5,561,948 |
| 2000 | 17.80 | 1,096 | 5,595,211 |
| 2001 | 17.77 | 1,106 | 5,641,142 |
| 2002 | 19.03 | 1,187 | 5,674,825 |
| 2003 | 20.60 | 1,293 | 5,709,403 |
| 2004 | 21.87 | 1,381 | 5,747,741 |
| 2005 | 25.57 | 1,635 | 5,790,300 |
| 2006 | 25.07 | 1,632 | 5,842,704 |
| 2007 | 25.45 | 1,681 | 5,887,612 |
| 2008 | 29.96 | 2,010 | 5,923,916 |
| 2009 | 25.54 | 1,728 | 5,961,088 |
| 2010 | 28.76 | 1,986 | 5,988,927 |
| 2011 | 27.35 | 1,927 | 6,010,688 |
| 2012 | 25.94 | 1,863 | 6,021,988 |
| 2013 | 27.49 | 2,026 | 6,044,171 |
| 2014 | 27.41 | 2,053 | 6,063,589 |
| 2015 | 28.68 | 2,173 | 6,083,672 |
| 2016 | 29.96 | 2,302 | 6,093,000 |
| 2017 | 32.29 | 2,545 | 6,113,532 |
| 2018 | 32.91 | 2,641 | 6,126,452 |
| 2019 | 34.12 | 2,782 | 6,137,428 |
| 2020 | 34.87 | 2,873 | 6,151,548 |
| 2021 | 33.04 | 2,517 | 6,168,187 |

| Date | Rate | Total | Population |
| 1999 | 28.33 | 1,716 | 5,561,948 |
| 2000 | 26.70 | 1,629 | 5,595,211 |
| 2001 | 26.06 | 1,604 | 5,641,142 |
| 2002 | 26.24 | 1,619 | 5,674,825 |
| 2003 | 25.74 | 1,604 | 5,709,403 |
| 2004 | 22.14 | 1,389 | 5,747,741 |
| 2005 | 24.03 | 1,527 | 5,790,300 |
| 2006 | 19.92 | 1,285 | 5,842,704 |
| 2007 | 19.58 | 1,289 | 5,887,612 |
| 2008 | 21.28 | 1,414 | 5,923,916 |
| 2009 | 19.72 | 1,330 | 5,961,088 |
| 2010 | 17.42 | 1,188 | 5,988,927 |
| 2011 | 17.23 | 1,205 | 6,010,688 |
| 2012 | 16.98 | 1,213 | 6,021,988 |
| 2013 | 18.69 | 1,352 | 6,044,171 |
| 2014 | 18.07 | 1,321 | 6,063,589 |
| 2015 | 17.86 | 1,337 | 6,083,672 |
| 2016 | 15.14 | 1,150 | 6,093,000 |
| 2017 | 16.71 | 1,281 | 6,113,532 |
| 2018 | 18.72 | 1,477 | 6,126,452 |
| 2019 | 13.10 | 1,038 | 6,137,428 |
| 2020 | 14.32 | 1,167 | 6,151,548 |
| 2021 | 11.46 | 884 | 6,168,187 |

| Date | Rate | Total | Population |
| 1999 | 15.11 | 907 | 5,561,948 |
| 2000 | 15.04 | 907 | 5,595,211 |
| 2001 | 16.31 | 991 | 5,641,142 |
| 2002 | 17.57 | 1,076 | 5,674,825 |
| 2003 | 17.75 | 1,099 | 5,709,403 |
| 2004 | 17.38 | 1,083 | 5,747,741 |
| 2005 | 18.35 | 1,156 | 5,790,300 |
| 2006 | 17.42 | 1,118 | 5,842,704 |
| 2007 | 18.16 | 1,184 | 5,887,612 |
| 2008 | 19.12 | 1,274 | 5,923,916 |
| 2009 | 18.27 | 1,223 | 5,961,088 |
| 2010 | 19.19 | 1,305 | 5,988,927 |
| 2011 | 17.88 | 1,245 | 6,010,688 |
| 2012 | 17.78 | 1,259 | 6,021,988 |
| 2013 | 18.03 | 1,305 | 6,044,171 |
| 2014 | 19.61 | 1,452 | 6,063,589 |
| 2015 | 19.89 | 1,483 | 6,083,672 |
| 2016 | 19.55 | 1,483 | 6,093,000 |
| 2017 | 19.64 | 1,515 | 6,113,532 |
| 2018 | 19.07 | 1,503 | 6,126,452 |
| 2019 | 18.41 | 1,483 | 6,137,428 |
| 2020 | 20.76 | 1,682 | 6,151,548 |
| 2021 | 19.93 | 1,542 | 6,168,187 |

| Date | Rate | Total | Population |
| 1999 | 10.71 | 633 | 5,561,948 |
| 2000 | 10.39 | 621 | 5,595,211 |
| 2001 | 9.98 | 602 | 5,641,142 |
| 2002 | 13.04 | 791 | 5,674,825 |
| 2003 | 11.78 | 723 | 5,709,403 |
| 2004 | 10.72 | 669 | 5,747,741 |
| 2005 | 11.82 | 741 | 5,790,300 |
| 2006 | 11.36 | 725 | 5,842,704 |
| 2007 | 10.64 | 691 | 5,887,612 |
| 2008 | 12.45 | 814 | 5,923,916 |
| 2009 | 11.75 | 783 | 5,961,088 |
| 2010 | 10.43 | 709 | 5,988,927 |
| 2011 | 11.54 | 794 | 6,010,688 |
| 2012 | 11.07 | 778 | 6,021,988 |
| 2013 | 11.24 | 809 | 6,044,171 |
| 2014 | 10.78 | 790 | 6,063,589 |
| 2015 | 11.59 | 856 | 6,083,672 |
| 2016 | 10.97 | 822 | 6,093,000 |
| 2017 | 11.32 | 861 | 6,113,532 |
| 2018 | 11.18 | 881 | 6,126,452 |
| 2019 | 11.18 | 887 | 6,137,428 |
| 2020 | 11.91 | 951 | 6,151,548 |
| 2021 | 12.70 | 997 | 6,168,187 |

| Date | Rate | Total | Population |
| 1999 | 12.55 | 700 | 5,561,948 |
| 2000 | 12.46 | 699 | 5,595,211 |
| 2001 | 12.77 | 725 | 5,641,142 |
| 2002 | 12.13 | 693 | 5,674,825 |
| 2003 | 11.83 | 679 | 5,709,403 |
| 2004 | 12.38 | 715 | 5,747,741 |
| 2005 | 12.50 | 727 | 5,790,300 |
| 2006 | 13.53 | 799 | 5,842,704 |
| 2007 | 13.54 | 808 | 5,887,612 |
| 2008 | 12.95 | 779 | 5,923,916 |
| 2009 | 14.27 | 860 | 5,961,088 |
| 2010 | 14.05 | 856 | 5,988,927 |
| 2011 | 15.29 | 933 | 6,010,688 |
| 2012 | 14.91 | 914 | 6,021,988 |
| 2013 | 15.64 | 960 | 6,044,171 |
| 2014 | 16.33 | 1,017 | 6,063,589 |
| 2015 | 17.08 | 1,052 | 6,083,672 |
| 2016 | 18.36 | 1,133 | 6,093,000 |
| 2017 | 18.49 | 1,151 | 6,113,532 |
| 2018 | 19.51 | 1,230 | 6,126,452 |
| 2019 | 18.23 | 1,141 | 6,137,428 |
| 2020 | 18.23 | 1,125 | 6,151,548 |
| 2021 | 18.72 | 1,177 | 6,168,187 |

| Date | Rate | Total | Population |
| 1999 | 5.59 | 336 | 5,561,948 |
| 2000 | 5.84 | 355 | 5,595,211 |
| 2001 | 5.90 | 361 | 5,641,142 |
| 2002 | 7.46 | 458 | 5,674,825 |
| 2003 | 6.82 | 424 | 5,709,403 |
| 2004 | 6.87 | 432 | 5,747,741 |
| 2005 | 7.36 | 468 | 5,790,300 |
| 2006 | 6.67 | 430 | 5,842,704 |
| 2007 | 6.14 | 404 | 5,887,612 |
| 2008 | 7.51 | 504 | 5,923,916 |
| 2009 | 6.67 | 451 | 5,961,088 |
| 2010 | 6.30 | 437 | 5,988,927 |
| 2011 | 6.52 | 462 | 6,010,688 |
| 2012 | 6.72 | 483 | 6,021,988 |
| 2013 | 6.07 | 442 | 6,044,171 |
| 2014 | 6.24 | 469 | 6,063,589 |
| 2015 | 6.73 | 513 | 6,083,672 |
| 2016 | 7.10 | 543 | 6,093,000 |
| 2017 | 9.00 | 700 | 6,113,532 |
| 2018 | 7.64 | 608 | 6,126,452 |
| 2019 | 5.88 | 472 | 6,137,428 |
| 2020 | 7.18 | 577 | 6,151,548 |
| 2021 | 6.49 | 501 | 6,168,187 |

| Date | Rate | Total | Population |
| 1999 | 7.53 | 428 | 5,561,948 |
| 2000 | 7.02 | 405 | 5,595,211 |
| 2001 | 7.51 | 439 | 5,641,142 |
| 2002 | 7.34 | 433 | 5,674,825 |
| 2003 | 7.16 | 429 | 5,709,403 |
| 2004 | 7.06 | 432 | 5,747,741 |
| 2005 | 6.73 | 419 | 5,790,300 |
| 2006 | 7.25 | 458 | 5,842,704 |
| 2007 | 6.66 | 433 | 5,887,612 |
| 2008 | 7.82 | 514 | 5,923,916 |
| 2009 | 7.62 | 512 | 5,961,088 |
| 2010 | 7.85 | 530 | 5,988,927 |
| 2011 | 7.49 | 516 | 6,010,688 |
| 2012 | 8.31 | 574 | 6,021,988 |
| 2013 | 8.43 | 598 | 6,044,171 |
| 2014 | 8.77 | 623 | 6,063,589 |
| 2015 | 9.58 | 678 | 6,083,672 |
| 2016 | 9.05 | 660 | 6,093,000 |
| 2017 | 9.33 | 690 | 6,113,532 |
| 2018 | 9.63 | 718 | 6,126,452 |
| 2019 | 10.08 | 743 | 6,137,428 |
| 2020 | 12.29 | 900 | 6,151,548 |
| 2021 | 12.99 | 958 | 6,168,187 |

| Date | Rate | Total | Population |
| 1999 | 5.24 | 315 | 5,561,948 |
| 2000 | 5.72 | 346 | 5,595,211 |
| 2001 | 6.09 | 371 | 5,641,142 |
| 2002 | 6.06 | 371 | 5,674,825 |
| 2003 | 6.19 | 384 | 5,709,403 |
| 2004 | 6.43 | 401 | 5,747,741 |
| 2005 | 6.64 | 418 | 5,790,300 |
| 2006 | 6.20 | 397 | 5,842,704 |
| 2007 | 6.48 | 418 | 5,887,612 |
| 2008 | 7.40 | 484 | 5,923,916 |
| 2009 | 6.33 | 417 | 5,961,088 |
| 2010 | 7.19 | 477 | 5,988,927 |
| 2011 | 7.49 | 508 | 6,010,688 |
| 2012 | 7.69 | 533 | 6,021,988 |
| 2013 | 7.79 | 554 | 6,044,171 |
| 2014 | 8.22 | 591 | 6,063,589 |
| 2015 | 7.68 | 560 | 6,083,672 |
| 2016 | 8.10 | 601 | 6,093,000 |
| 2017 | 8.14 | 621 | 6,113,532 |
| 2018 | 9.22 | 719 | 6,126,452 |
| 2019 | 9.22 | 736 | 6,137,428 |
| 2020 | 10.79 | 872 | 6,151,548 |
| 2021 | 10.56 | 803 | 6,168,187 |

| Date | Rate | Total | Population |
| 1999 | 6.98 | 385 | 5,561,948 |
| 2000 | 7.18 | 398 | 5,595,211 |
| 2001 | 7.79 | 437 | 5,641,142 |
| 2002 | 6.51 | 366 | 5,674,825 |
| 2003 | 5.75 | 323 | 5,709,403 |
| 2004 | 6.47 | 369 | 5,747,741 |
| 2005 | 7.32 | 417 | 5,790,300 |
| 2006 | 7.16 | 412 | 5,842,704 |
| 2007 | 6.60 | 384 | 5,887,612 |
| 2008 | 8.35 | 482 | 5,923,916 |
| 2009 | 7.34 | 428 | 5,961,088 |
| 2010 | 7.50 | 438 | 5,988,927 |
| 2011 | 7.24 | 419 | 6,010,688 |
| 2012 | 7.32 | 424 | 6,021,988 |
| 2013 | 6.75 | 392 | 6,044,171 |
| 2014 | 7.55 | 441 | 6,063,589 |
| 2015 | 9.58 | 547 | 6,083,672 |
| 2016 | 9.95 | 570 | 6,093,000 |
| 2017 | 11.29 | 655 | 6,113,532 |
| 2018 | 11.44 | 658 | 6,126,452 |
| 2019 | 10.83 | 628 | 6,137,428 |
| 2020 | 13.96 | 803 | 6,151,548 |
| 2021 | 12.38 | 716 | 6,168,187 |
CHOOSE NEW STATE
COVID-19 UPDATE
4/1/24
| CASES | DEATHS |
|
1,780,715
|
22,778
|
COVID-19 DEATH SIMULATOR
Current Covid-19 deaths compared to a simulated calendar based historical average of selected Missouri causes.

WITH STATE ADJUSTMENTS

WITH STATE ADJUSTMENTS

WITH STATE ADJUSTMENTS
Centers for Disease Control and Prevention: Final Deaths 2021 Release Date 12/22.


