HEALTH RANKINGS Georgia

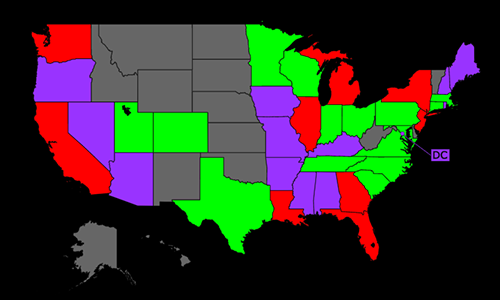
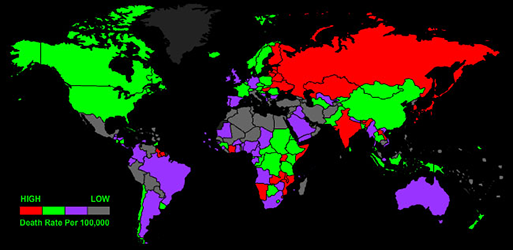
AGE-STANDARDIZED DEATH RATE: CDC 12/22
PER 100,000 POPULATION
GOOD
POOR
| CAUSES OF DEATH | Rate | USA Rank | |
| 1. | COVID-19 |
135.91
|
13
|
| 2. | Coronary Heart Disease |
75.03
|
42
|
| 3. | Stroke |
47.89
|
8
|
| 4. | Hypertension |
47.30
|
6
|
| 5. | Alzheimers |
44.52
|
4
|
| 6. | Lung Disease |
40.04
|
16
|
| 7. | Lung Cancers |
33.02
|
24
|
| 8. | Diabetes Mellitus |
25.06
|
26
|
| 9. | Poisonings |
22.93
|
39
|
| 10. | Breast Cancer |
22.16
|
6
|
| 11. | Prostate Cancer |
21.27
|
10
|
| 12. | Kidney Disease |
20.41
|
6
|
| 13. | Endocrine Disorders |
15.39
|
27
|
| 14. | Suicide |
15.25
|
27
|
| 15. | Colon-Rectum Cancers |
14.33
|
19
|
| 16. | Liver Disease |
13.27
|
35
|
| 17. | Homicide |
11.42
|
12
|
| 18. | Influenza & Pneumonia |
11.36
|
18
|
| 19. | Pancreas Cancer |
11.34
|
31
|
| 20. | Parkinson's Disease |
10.46
|
20
|
| CAUSES OF DEATH | Rate | USA Rank | |
| 21. | Falls |
8.61
|
45
|
| 22. | Lymphomas |
8.30
|
33
|
| 23. | Inflammatory/Heart |
6.74
|
35
|
| 24. | Liver Cancer |
6.51
|
27
|
| 25. | Ovary Cancer |
6.29
|
16
|
| 26. | Leukemia |
5.66
|
38
|
| 27. | Uterin Cancer |
5.16
|
27
|
| 28. | Bladder Cancer |
4.27
|
24
|
| 29. | Other Neoplasms |
4.20
|
28
|
| 30. | Alcohol |
4.07
|
36
|
| 31. | Oesophagus Cancer |
3.40
|
38
|
| 32. | Congenital Anomalies |
3.06
|
32
|
| 33. | Skin Cancers |
3.02
|
37
|
| 34. | Oral Cancer |
2.87
|
25
|
| 35. | Stomach Cancer |
2.83
|
14
|
| 36. | HIV/AIDS |
2.50
|
4
|
| 37. | Cervical Cancer |
2.41
|
19
|
| 38. | Low Birth Weight |
1.96
|
10
|
| 39. | Drownings |
1.26
|
24
|
| 40. | Drug Use |
1.07
|
22
|

PERCENT TOP 50 CAUSES: CDC 12/22
| CAUSES OF DEATH | Deaths | % | |
| 1. | COVID-19 |
15,816
|
18.97
|
| 2. | Coronary Heart Disease |
8,589
|
10.30
|
| 3. | Hypertension |
5,333
|
6.40
|
| 4. | Stroke |
5,212
|
6.25
|
| 5. | Lung Disease |
4,586
|
5.50
|
| 6. | Alzheimers |
4,376
|
5.25
|
| 7. | Lung Cancers |
4,063
|
4.87
|
| 8. | Diabetes Mellitus |
2,937
|
3.52
|
| 9. | Poisonings |
2,433
|
2.92
|
| 10. | Kidney Disease |
2,311
|
2.77
|
| 11. | Road Traffic Accidents |
1,942
|
2.33
|
| 12. | Endocrine Disorders |
1,736
|
2.08
|
| 13. | Colon-Rectum Cancers |
1,703
|
2.04
|
| 14. | Suicide |
1,676
|
2.01
|
| 15. | Liver Disease |
1,631
|
1.96
|
| 16. | Breast Cancer |
1,465
|
1.76
|
| 17. | Pancreas Cancer |
1,364
|
1.64
|
| 18. | Influenza & Pneumonia |
1,258
|
1.51
|
| 19. | Homicide |
1,195
|
1.43
|
| 20. | Parkinson's Disease |
1,088
|
1.30
|
| 21. | Prostate Cancer |
993
|
1.19
|
| 22. | Other Injuries |
971
|
1.16
|
| 23. | Lymphomas |
953
|
1.14
|
| 24. | Falls |
909
|
1.09
|
| 25. | Malnutrition |
827
|
0.99
|
| CAUSES OF DEATH | Deaths | % | |
| 26. | Liver Cancer |
808
|
0.97
|
| 27. | Inflammatory/Heart |
737
|
0.88
|
| 28. | Leukemia |
622
|
0.75
|
| 29. | Alcohol |
484
|
0.58
|
| 30. | Bladder Cancer |
472
|
0.57
|
| 31. | Other Neoplasms |
455
|
0.55
|
| 32. | Oesophagus Cancer |
421
|
0.50
|
| 33. | Ovary Cancer |
401
|
0.48
|
| 34. | Oral Cancer |
350
|
0.42
|
| 35. | Uterin Cancer |
348
|
0.42
|
| 36. | Skin Cancers |
346
|
0.41
|
| 37. | Stomach Cancer |
327
|
0.39
|
| 38. | Congenital Anomalies |
289
|
0.35
|
| 39. | HIV/AIDS |
285
|
0.34
|
| 40. | Skin Disease |
171
|
0.21
|
| 41. | Low Birth Weight |
168
|
0.20
|
| 42. | Diarrhoeal diseases |
146
|
0.18
|
| 43. | Cervical Cancer |
133
|
0.16
|
| 44. | Drownings |
125
|
0.15
|
| 45. | Drug Use |
119
|
0.14
|
| 46. | Multiple Sclerosis |
109
|
0.13
|
| 47. | Fires |
100
|
0.12
|
| 48. | Maternal Conditions |
94
|
0.11
|
| 49. | Asthma |
91
|
0.11
|
| 50. | Anaemia |
91
|
0.11
|

AGE-STANDARDIZED DEATH RATE: CDC 12/22
PER 100,000 POPULATION
GOOD
POOR
| Rate | USA Rank | ||
| 1. | Lung Cancers |
33.02
|
24
|
| 2. | Breast Cancer |
22.16
|
6
|
| 3. | Prostate Cancer |
21.27
|
10
|
| 4. | Colon-Rectum Cancers |
14.33
|
19
|
| 5. | Pancreas Cancer |
11.34
|
31
|
| 6. | Lymphomas |
8.30
|
33
|
| 7. | Liver Cancer |
6.51
|
27
|
| 8. | Ovary Cancer |
6.29
|
16
|
| Rate | USA Rank | ||
| 9. | Leukemia |
5.66
|
38
|
| 10. | Uterin Cancer |
5.16
|
27
|
| 11. | Bladder Cancer |
4.27
|
24
|
| 12. | Oesophagus Cancer |
3.40
|
38
|
| 13. | Skin Cancers |
3.02
|
37
|
| 14. | Oral Cancer |
2.87
|
25
|
| 15. | Stomach Cancer |
2.83
|
14
|
| 16. | Cervical Cancer |
2.41
|
19
|
DEATH RATE HISTORY SELECTED CAUSES

| Date | Rate | Total | Population |
| 1999 | 282.77 | 17,597 | 8,045,965 |
| 2000 | 276.04 | 17,406 | 8,186,453 |
| 2001 | 271.40 | 17,478 | 8,377,038 |
| 2002 | 265.80 | 17,529 | 8,508,256 |
| 2003 | 255.22 | 17,188 | 8,622,793 |
| 2004 | 240.28 | 16,557 | 8,769,252 |
| 2005 | 236.00 | 16,781 | 8,925,922 |
| 2006 | 222.21 | 16,478 | 9,155,813 |
| 2007 | 212.03 | 16,184 | 9,349,988 |
| 2008 | 199.06 | 15,721 | 9,504,843 |
| 2009 | 198.45 | 16,165 | 9,620,846 |
| 2010 | 192.63 | 15,987 | 9,687,653 |
| 2011 | 182.54 | 15,773 | 9,815,210 |
| 2012 | 177.58 | 15,825 | 9,919,945 |
| 2013 | 178.74 | 16,550 | 9,992,167 |
| 2014 | 179.74 | 17,107 | 10,097,343 |
| 2015 | 180.25 | 17,769 | 10,214,860 |
| 2016 | 179.00 | 18,143 | 10,310,371 |
| 2017 | 175.77 | 18,389 | 10,429,379 |
| 2018 | 175.77 | 18,986 | 10,519,475 |
| 2019 | 175.49 | 19,543 | 10,617,423 |
| 2020 | 183.72 | 21,116 | 10,710,017 |
| 2021 | 195.21 | 21,931 | 10,799,566 |

| Date | Rate | Total | Population |
| 1999 | 202.25 | 13,225 | 8,045,965 |
| 2000 | 206.67 | 13,690 | 8,186,453 |
| 2001 | 202.82 | 13,818 | 8,377,038 |
| 2002 | 200.03 | 13,975 | 8,508,256 |
| 2003 | 196.29 | 14,032 | 8,622,793 |
| 2004 | 195.46 | 14,313 | 8,769,252 |
| 2005 | 189.86 | 14,358 | 8,925,922 |
| 2006 | 184.01 | 14,474 | 9,155,813 |
| 2007 | 185.52 | 14,983 | 9,349,988 |
| 2008 | 175.07 | 14,621 | 9,504,843 |
| 2009 | 175.62 | 15,143 | 9,620,846 |
| 2010 | 174.84 | 15,435 | 9,687,653 |
| 2011 | 170.34 | 15,602 | 9,815,210 |
| 2012 | 169.06 | 16,021 | 9,919,945 |
| 2013 | 167.65 | 16,417 | 9,992,167 |
| 2014 | 165.45 | 16,684 | 10,097,343 |
| 2015 | 162.98 | 16,945 | 10,214,860 |
| 2016 | 160.24 | 17,184 | 10,310,371 |
| 2017 | 154.88 | 17,135 | 10,429,379 |
| 2018 | 152.36 | 17,397 | 10,519,475 |
| 2019 | 151.42 | 17,756 | 10,617,423 |
| 2020 | 147.63 | 17,827 | 10,710,017 |
| 2021 | 151.53 | 18,136 | 10,799,566 |

| Date | Rate | Total | Population |
| 1999 | 72.26 | 4,416 | 8,045,965 |
| 2000 | 74.84 | 4,625 | 8,186,453 |
| 2001 | 68.33 | 4,312 | 8,377,038 |
| 2002 | 66.54 | 4,261 | 8,508,256 |
| 2003 | 65.57 | 4,301 | 8,622,793 |
| 2004 | 60.77 | 4,063 | 8,769,252 |
| 2005 | 55.60 | 3,854 | 8,925,922 |
| 2006 | 53.53 | 3,889 | 9,155,813 |
| 2007 | 52.04 | 3,894 | 9,349,988 |
| 2008 | 49.48 | 3,805 | 9,504,843 |
| 2009 | 46.94 | 3,732 | 9,620,846 |
| 2010 | 46.33 | 3,762 | 9,687,653 |
| 2011 | 42.65 | 3,564 | 9,815,210 |
| 2012 | 41.82 | 3,636 | 9,919,945 |
| 2013 | 41.36 | 3,694 | 9,992,167 |
| 2014 | 42.63 | 3,948 | 10,097,343 |
| 2015 | 45.35 | 4,335 | 10,214,860 |
| 2016 | 44.32 | 4,349 | 10,310,371 |
| 2017 | 43.51 | 4,399 | 10,429,379 |
| 2018 | 43.37 | 4,553 | 10,519,475 |
| 2019 | 41.87 | 4,539 | 10,617,423 |
| 2020 | 43.02 | 4,821 | 10,710,017 |
| 2021 | 47.89 | 5,233 | 10,799,566 |

| Date | Rate | Total | Population |
| 1999 | 49.06 | 3,056 | 8,045,965 |
| 2000 | 48.72 | 3,067 | 8,186,453 |
| 2001 | 48.26 | 3,097 | 8,377,038 |
| 2002 | 48.13 | 3,163 | 8,508,256 |
| 2003 | 48.72 | 3,254 | 8,622,793 |
| 2004 | 45.67 | 3,125 | 8,769,252 |
| 2005 | 48.44 | 3,411 | 8,925,922 |
| 2006 | 46.32 | 3,387 | 9,155,813 |
| 2007 | 45.12 | 3,384 | 9,349,988 |
| 2008 | 45.47 | 3,546 | 9,504,843 |
| 2009 | 46.70 | 3,736 | 9,620,846 |
| 2010 | 46.67 | 3,816 | 9,687,653 |
| 2011 | 45.26 | 3,837 | 9,815,210 |
| 2012 | 45.01 | 3,977 | 9,919,945 |
| 2013 | 45.43 | 4,172 | 9,992,167 |
| 2014 | 45.64 | 4,332 | 10,097,343 |
| 2015 | 46.74 | 4,607 | 10,214,860 |
| 2016 | 47.35 | 4,805 | 10,310,371 |
| 2017 | 46.22 | 4,866 | 10,429,379 |
| 2018 | 45.68 | 4,988 | 10,519,475 |
| 2019 | 42.10 | 4,749 | 10,617,423 |
| 2020 | 41.57 | 4,826 | 10,710,017 |
| 2021 | 41.09 | 4,709 | 10,799,566 |

| Date | Rate | Total | Population |
| 1999 | 41.52 | 3,078 | 8,045,965 |
| 2000 | 40.83 | 3,103 | 8,186,453 |
| 2001 | 43.84 | 3,396 | 8,377,038 |
| 2002 | 42.26 | 3,333 | 8,508,256 |
| 2003 | 44.23 | 3,528 | 8,622,793 |
| 2004 | 45.01 | 3,667 | 8,769,252 |
| 2005 | 45.01 | 3,762 | 8,925,922 |
| 2006 | 45.11 | 3,879 | 9,155,813 |
| 2007 | 45.37 | 4,012 | 9,349,988 |
| 2008 | 41.99 | 3,774 | 9,504,843 |
| 2009 | 42.12 | 3,812 | 9,620,846 |
| 2010 | 40.70 | 3,745 | 9,687,653 |
| 2011 | 40.19 | 3,785 | 9,815,210 |
| 2012 | 39.02 | 3,731 | 9,919,945 |
| 2013 | 38.26 | 3,727 | 9,992,167 |
| 2014 | 40.11 | 3,963 | 10,097,343 |
| 2015 | 43.19 | 4,344 | 10,214,860 |
| 2016 | 45.81 | 4,701 | 10,310,371 |
| 2017 | 45.23 | 4,712 | 10,429,379 |
| 2018 | 41.73 | 4,418 | 10,519,475 |
| 2019 | 42.25 | 4,563 | 10,617,423 |
| 2020 | 50.75 | 5,517 | 10,710,017 |
| 2021 | 58.82 | 6,353 | 10,799,566 |

| Date | Rate | Total | Population |
| 1999 | 22.64 | 1,448 | 8,045,965 |
| 2000 | 22.40 | 1,461 | 8,186,453 |
| 2001 | 22.07 | 1,475 | 8,377,038 |
| 2002 | 23.05 | 1,576 | 8,508,256 |
| 2003 | 24.44 | 1,717 | 8,622,793 |
| 2004 | 22.51 | 1,623 | 8,769,252 |
| 2005 | 23.24 | 1,742 | 8,925,922 |
| 2006 | 21.17 | 1,657 | 9,155,813 |
| 2007 | 20.00 | 1,604 | 9,349,988 |
| 2008 | 18.04 | 1,496 | 9,504,843 |
| 2009 | 18.69 | 1,582 | 9,620,846 |
| 2010 | 23.11 | 1,996 | 9,687,653 |
| 2011 | 23.62 | 2,121 | 9,815,210 |
| 2012 | 22.60 | 2,088 | 9,919,945 |
| 2013 | 22.96 | 2,199 | 9,992,167 |
| 2014 | 22.27 | 2,230 | 10,097,343 |
| 2015 | 21.37 | 2,210 | 10,214,860 |
| 2016 | 21.21 | 2,238 | 10,310,371 |
| 2017 | 21.52 | 2,348 | 10,429,379 |
| 2018 | 22.06 | 2,471 | 10,519,475 |
| 2019 | 20.48 | 2,375 | 10,617,423 |
| 2020 | 23.85 | 2,833 | 10,710,017 |
| 2021 | 25.06 | 2,943 | 10,799,566 |

| Date | Rate | Total | Population |
| 1999 | 18.79 | 1,080 | 8,045,965 |
| 2000 | 21.25 | 1,235 | 8,186,453 |
| 2001 | 24.05 | 1,419 | 8,377,038 |
| 2002 | 25.47 | 1,525 | 8,508,256 |
| 2003 | 26.87 | 1,630 | 8,622,793 |
| 2004 | 27.76 | 1,710 | 8,769,252 |
| 2005 | 27.38 | 1,745 | 8,925,922 |
| 2006 | 27.53 | 1,820 | 9,155,813 |
| 2007 | 27.17 | 1,849 | 9,349,988 |
| 2008 | 27.52 | 1,929 | 9,504,843 |
| 2009 | 25.87 | 1,865 | 9,620,846 |
| 2010 | 28.31 | 2,080 | 9,687,653 |
| 2011 | 28.94 | 2,218 | 9,815,210 |
| 2012 | 26.22 | 2,074 | 9,919,945 |
| 2013 | 24.98 | 2,048 | 9,992,167 |
| 2014 | 31.73 | 2,670 | 10,097,343 |
| 2015 | 42.42 | 3,714 | 10,214,860 |
| 2016 | 44.79 | 4,021 | 10,310,371 |
| 2017 | 46.03 | 4,290 | 10,429,379 |
| 2018 | 46.54 | 4,513 | 10,519,475 |
| 2019 | 41.94 | 4,221 | 10,617,423 |
| 2020 | 45.87 | 4,782 | 10,710,017 |
| 2021 | 44.52 | 4,378 | 10,799,566 |

| Date | Rate | Total | Population |
| 1999 | 28.33 | 1,703 | 8,045,965 |
| 2000 | 29.44 | 1,792 | 8,186,453 |
| 2001 | 24.40 | 1,515 | 8,377,038 |
| 2002 | 28.54 | 1,791 | 8,508,256 |
| 2003 | 26.25 | 1,687 | 8,622,793 |
| 2004 | 23.81 | 1,547 | 8,769,252 |
| 2005 | 23.53 | 1,596 | 8,925,922 |
| 2006 | 20.75 | 1,463 | 9,155,813 |
| 2007 | 19.39 | 1,407 | 9,349,988 |
| 2008 | 19.82 | 1,498 | 9,504,843 |
| 2009 | 19.16 | 1,500 | 9,620,846 |
| 2010 | 18.29 | 1,456 | 9,687,653 |
| 2011 | 17.49 | 1,457 | 9,815,210 |
| 2012 | 16.39 | 1,390 | 9,919,945 |
| 2013 | 16.80 | 1,494 | 9,992,167 |
| 2014 | 16.18 | 1,510 | 10,097,343 |
| 2015 | 15.48 | 1,467 | 10,214,860 |
| 2016 | 14.31 | 1,423 | 10,310,371 |
| 2017 | 13.76 | 1,400 | 10,429,379 |
| 2018 | 14.50 | 1,530 | 10,519,475 |
| 2019 | 11.83 | 1,299 | 10,617,423 |
| 2020 | 13.81 | 1,575 | 10,710,017 |
| 2021 | 11.31 | 1,273 | 10,799,566 |

| Date | Rate | Total | Population |
| 1999 | 18.32 | 1,142 | 8,045,965 |
| 2000 | 20.01 | 1,263 | 8,186,453 |
| 2001 | 21.10 | 1,362 | 8,377,038 |
| 2002 | 20.39 | 1,335 | 8,508,256 |
| 2003 | 21.89 | 1,471 | 8,622,793 |
| 2004 | 21.27 | 1,458 | 8,769,252 |
| 2005 | 21.23 | 1,520 | 8,925,922 |
| 2006 | 22.54 | 1,668 | 9,155,813 |
| 2007 | 22.31 | 1,689 | 9,349,988 |
| 2008 | 21.29 | 1,668 | 9,504,843 |
| 2009 | 23.22 | 1,866 | 9,620,846 |
| 2010 | 21.28 | 1,753 | 9,687,653 |
| 2011 | 18.37 | 1,571 | 9,815,210 |
| 2012 | 18.44 | 1,612 | 9,919,945 |
| 2013 | 18.06 | 1,652 | 9,992,167 |
| 2014 | 18.47 | 1,742 | 10,097,343 |
| 2015 | 19.15 | 1,881 | 10,214,860 |
| 2016 | 18.45 | 1,864 | 10,310,371 |
| 2017 | 18.63 | 1,942 | 10,429,379 |
| 2018 | 18.47 | 2,006 | 10,519,475 |
| 2019 | 18.09 | 2,023 | 10,617,423 |
| 2020 | 18.47 | 2,134 | 10,710,017 |
| 2021 | 20.02 | 2,269 | 10,799,566 |

| Date | Rate | Total | Population |
| 1999 | 18.17 | 1,137 | 8,045,965 |
| 2000 | 18.46 | 1,171 | 8,186,453 |
| 2001 | 20.04 | 1,313 | 8,377,038 |
| 2002 | 19.46 | 1,293 | 8,508,256 |
| 2003 | 19.74 | 1,342 | 8,622,793 |
| 2004 | 18.78 | 1,305 | 8,769,252 |
| 2005 | 18.13 | 1,321 | 8,925,922 |
| 2006 | 18.97 | 1,426 | 9,155,813 |
| 2007 | 18.44 | 1,442 | 9,349,988 |
| 2008 | 19.48 | 1,559 | 9,504,843 |
| 2009 | 18.35 | 1,501 | 9,620,846 |
| 2010 | 16.41 | 1,387 | 9,687,653 |
| 2011 | 16.01 | 1,400 | 9,815,210 |
| 2012 | 16.05 | 1,453 | 9,919,945 |
| 2013 | 16.56 | 1,560 | 9,992,167 |
| 2014 | 15.24 | 1,491 | 10,097,343 |
| 2015 | 15.19 | 1,526 | 10,214,860 |
| 2016 | 15.12 | 1,565 | 10,310,371 |
| 2017 | 15.17 | 1,611 | 10,429,379 |
| 2018 | 15.35 | 1,674 | 10,519,475 |
| 2019 | 15.03 | 1,709 | 10,617,423 |
| 2020 | 15.64 | 1,841 | 10,710,017 |
| 2021 | 15.50 | 1,797 | 10,799,566 |

| Date | Rate | Total | Population |
| 1999 | 11.15 | 873 | 8,045,965 |
| 2000 | 10.66 | 847 | 8,186,453 |
| 2001 | 11.41 | 935 | 8,377,038 |
| 2002 | 11.05 | 909 | 8,508,256 |
| 2003 | 11.62 | 972 | 8,622,793 |
| 2004 | 11.32 | 973 | 8,769,252 |
| 2005 | 10.57 | 924 | 8,925,922 |
| 2006 | 10.28 | 923 | 9,155,813 |
| 2007 | 10.88 | 997 | 9,349,988 |
| 2008 | 10.40 | 981 | 9,504,843 |
| 2009 | 11.86 | 1,134 | 9,620,846 |
| 2010 | 11.67 | 1,133 | 9,687,653 |
| 2011 | 11.70 | 1,157 | 9,815,210 |
| 2012 | 11.67 | 1,168 | 9,919,945 |
| 2013 | 11.97 | 1,212 | 9,992,167 |
| 2014 | 12.64 | 1,295 | 10,097,343 |
| 2015 | 12.70 | 1,317 | 10,214,860 |
| 2016 | 13.33 | 1,409 | 10,310,371 |
| 2017 | 13.59 | 1,451 | 10,429,379 |
| 2018 | 14.57 | 1,569 | 10,519,475 |
| 2019 | 14.64 | 1,585 | 10,617,423 |
| 2020 | 13.70 | 1,491 | 10,710,017 |
| 2021 | 15.25 | 1,676 | 10,799,566 |

| Date | Rate | Total | Population |
| 1999 | 9.13 | 573 | 8,045,965 |
| 2000 | 11.17 | 712 | 8,186,453 |
| 2001 | 10.27 | 660 | 8,377,038 |
| 2002 | 10.80 | 712 | 8,508,256 |
| 2003 | 13.23 | 898 | 8,622,793 |
| 2004 | 12.58 | 864 | 8,769,252 |
| 2005 | 13.01 | 922 | 8,925,922 |
| 2006 | 12.73 | 942 | 9,155,813 |
| 2007 | 12.05 | 934 | 9,349,988 |
| 2008 | 11.80 | 945 | 9,504,843 |
| 2009 | 11.82 | 954 | 9,620,846 |
| 2010 | 12.87 | 1,076 | 9,687,653 |
| 2011 | 12.01 | 1,028 | 9,815,210 |
| 2012 | 12.80 | 1,146 | 9,919,945 |
| 2013 | 11.76 | 1,084 | 9,992,167 |
| 2014 | 11.17 | 1,070 | 10,097,343 |
| 2015 | 10.85 | 1,076 | 10,214,860 |
| 2016 | 11.49 | 1,172 | 10,310,371 |
| 2017 | 11.60 | 1,220 | 10,429,379 |
| 2018 | 10.68 | 1,154 | 10,519,475 |
| 2019 | 10.46 | 1,183 | 10,617,423 |
| 2020 | 12.19 | 1,412 | 10,710,017 |
| 2021 | 12.99 | 1,480 | 10,799,566 |

| Date | Rate | Total | Population |
| 1999 | 8.82 | 627 | 8,045,965 |
| 2000 | 8.76 | 631 | 8,186,453 |
| 2001 | 8.66 | 654 | 8,377,038 |
| 2002 | 9.00 | 696 | 8,508,256 |
| 2003 | 8.51 | 680 | 8,622,793 |
| 2004 | 8.29 | 676 | 8,769,252 |
| 2005 | 8.21 | 689 | 8,925,922 |
| 2006 | 7.66 | 664 | 9,155,813 |
| 2007 | 7.68 | 686 | 9,349,988 |
| 2008 | 7.18 | 665 | 9,504,843 |
| 2009 | 7.16 | 694 | 9,620,846 |
| 2010 | 7.54 | 743 | 9,687,653 |
| 2011 | 7.64 | 767 | 9,815,210 |
| 2012 | 8.31 | 870 | 9,919,945 |
| 2013 | 8.49 | 898 | 9,992,167 |
| 2014 | 8.57 | 935 | 10,097,343 |
| 2015 | 8.99 | 1,003 | 10,214,860 |
| 2016 | 9.02 | 1,009 | 10,310,371 |
| 2017 | 9.80 | 1,146 | 10,429,379 |
| 2018 | 9.88 | 1,171 | 10,519,475 |
| 2019 | 10.03 | 1,230 | 10,617,423 |
| 2020 | 12.09 | 1,470 | 10,710,017 |
| 2021 | 13.30 | 1,636 | 10,799,566 |

| Date | Rate | Total | Population |
| 1999 | 4.64 | 274 | 8,045,965 |
| 2000 | 5.16 | 306 | 8,186,453 |
| 2001 | 5.40 | 327 | 8,377,038 |
| 2002 | 5.62 | 345 | 8,508,256 |
| 2003 | 5.54 | 346 | 8,622,793 |
| 2004 | 5.39 | 345 | 8,769,252 |
| 2005 | 5.62 | 367 | 8,925,922 |
| 2006 | 5.93 | 404 | 9,155,813 |
| 2007 | 5.95 | 412 | 9,349,988 |
| 2008 | 6.00 | 427 | 9,504,843 |
| 2009 | 6.00 | 440 | 9,620,846 |
| 2010 | 6.31 | 472 | 9,687,653 |
| 2011 | 6.66 | 515 | 9,815,210 |
| 2012 | 6.57 | 537 | 9,919,945 |
| 2013 | 7.55 | 631 | 9,992,167 |
| 2014 | 8.31 | 716 | 10,097,343 |
| 2015 | 8.24 | 733 | 10,214,860 |
| 2016 | 8.75 | 816 | 10,310,371 |
| 2017 | 8.86 | 844 | 10,429,379 |
| 2018 | 9.22 | 928 | 10,519,475 |
| 2019 | 9.79 | 1,020 | 10,617,423 |
| 2020 | 10.85 | 1,175 | 10,710,017 |
| 2021 | 10.46 | 1,093 | 10,799,566 |

| Date | Rate | Total | Population |
| 1999 | 7.49 | 634 | 8,045,965 |
| 2000 | 7.77 | 659 | 8,186,453 |
| 2001 | 7.84 | 681 | 8,377,038 |
| 2002 | 7.58 | 672 | 8,508,256 |
| 2003 | 8.33 | 736 | 8,622,793 |
| 2004 | 7.36 | 659 | 8,769,252 |
| 2005 | 7.14 | 649 | 8,925,922 |
| 2006 | 7.32 | 687 | 9,155,813 |
| 2007 | 8.10 | 771 | 9,349,988 |
| 2008 | 7.44 | 712 | 9,504,843 |
| 2009 | 6.64 | 640 | 9,620,846 |
| 2010 | 6.56 | 640 | 9,687,653 |
| 2011 | 6.28 | 618 | 9,815,210 |
| 2012 | 6.52 | 657 | 9,919,945 |
| 2013 | 6.43 | 641 | 9,992,167 |
| 2014 | 6.56 | 658 | 10,097,343 |
| 2015 | 7.30 | 738 | 10,214,860 |
| 2016 | 7.90 | 806 | 10,310,371 |
| 2017 | 7.87 | 810 | 10,429,379 |
| 2018 | 7.70 | 794 | 10,519,475 |
| 2019 | 8.13 | 849 | 10,617,423 |
| 2020 | 10.47 | 1,093 | 10,710,017 |
| 2021 | 11.42 | 1,206 | 10,799,566 |
CHOOSE NEW STATE
COVID-19 UPDATE
4/1/24
| CASES | DEATHS |
|
3,287,483
|
44,069
|
COVID-19 DEATH SIMULATOR
Current Covid-19 deaths compared to a simulated calendar based historical average of selected Georgia causes.

WITH STATE ADJUSTMENTS

WITH STATE ADJUSTMENTS

WITH STATE ADJUSTMENTS
Centers for Disease Control and Prevention: Final Deaths 2021 Release Date 12/22.


