HEALTH RANKINGS Ohio

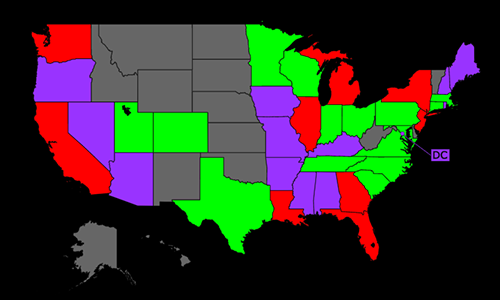
AGE-STANDARDIZED DEATH RATE: CDC 12/22
PER 100,000 POPULATION
GOOD
POOR
| CAUSES OF DEATH | Rate | USA Rank | |
| 1. | COVID-19 |
122.77
|
15
|
| 2. | Coronary Heart Disease |
105.85
|
12
|
| 3. | Stroke |
49.00
|
6
|
| 4. | Poisonings |
47.19
|
9
|
| 5. | Lung Disease |
40.54
|
14
|
| 6. | Lung Cancers |
39.43
|
10
|
| 7. | Alzheimers |
34.23
|
20
|
| 8. | Hypertension |
30.50
|
23
|
| 9. | Diabetes Mellitus |
29.55
|
11
|
| 10. | Breast Cancer |
20.28
|
18
|
| 11. | Prostate Cancer |
19.89
|
24
|
| 12. | Endocrine Disorders |
17.57
|
13
|
| 13. | Kidney Disease |
15.73
|
17
|
| 14. | Suicide |
14.65
|
33
|
| 15. | Colon-Rectum Cancers |
14.42
|
15
|
| 16. | Liver Disease |
14.19
|
30
|
| 17. | Falls |
12.97
|
23
|
| 18. | Pancreas Cancer |
11.78
|
21
|
| 19. | Influenza & Pneumonia |
11.44
|
17
|
| 20. | Parkinson's Disease |
10.15
|
28
|
| CAUSES OF DEATH | Rate | USA Rank | |
| 21. | Inflammatory/Heart |
9.79
|
3
|
| 22. | Homicide |
9.32
|
17
|
| 23. | Lymphomas |
9.17
|
16
|
| 24. | Liver Cancer |
6.49
|
29
|
| 25. | Leukemia |
6.19
|
18
|
| 26. | Ovary Cancer |
6.14
|
23
|
| 27. | Uterin Cancer |
5.43
|
21
|
| 28. | Oesophagus Cancer |
4.93
|
6
|
| 29. | Bladder Cancer |
4.81
|
10
|
| 30. | Other Neoplasms |
4.46
|
24
|
| 31. | Alcohol |
4.00
|
39
|
| 32. | Congenital Anomalies |
3.65
|
15
|
| 33. | Skin Cancers |
3.65
|
13
|
| 34. | Oral Cancer |
3.05
|
18
|
| 35. | Stomach Cancer |
2.39
|
31
|
| 36. | Cervical Cancer |
2.36
|
20
|
| 37. | Low Birth Weight |
2.13
|
5
|
| 38. | Drug Use |
1.38
|
14
|
| 39. | Drownings |
1.09
|
36
|
| 40. | HIV/AIDS |
0.90
|
23
|

PERCENT TOP 50 CAUSES: CDC 12/22
| CAUSES OF DEATH | Deaths | % | |
| 1. | COVID-19 |
18,272
|
16.43
|
| 2. | Coronary Heart Disease |
15,982
|
14.37
|
| 3. | Stroke |
7,232
|
6.50
|
| 4. | Lung Disease |
6,272
|
5.64
|
| 5. | Lung Cancers |
6,256
|
5.63
|
| 6. | Poisonings |
5,273
|
4.74
|
| 7. | Alzheimers |
4,940
|
4.44
|
| 8. | Hypertension |
4,516
|
4.06
|
| 9. | Diabetes Mellitus |
4,460
|
4.01
|
| 10. | Endocrine Disorders |
2,560
|
2.30
|
| 11. | Kidney Disease |
2,350
|
2.11
|
| 12. | Colon-Rectum Cancers |
2,170
|
1.95
|
| 13. | Liver Disease |
2,016
|
1.81
|
| 14. | Falls |
1,880
|
1.69
|
| 15. | Pancreas Cancer |
1,856
|
1.67
|
| 16. | Suicide |
1,766
|
1.59
|
| 17. | Influenza & Pneumonia |
1,671
|
1.50
|
| 18. | Breast Cancer |
1,667
|
1.50
|
| 19. | Road Traffic Accidents |
1,508
|
1.36
|
| 20. | Parkinson's Disease |
1,484
|
1.33
|
| 21. | Inflammatory/Heart |
1,399
|
1.26
|
| 22. | Lymphomas |
1,374
|
1.24
|
| 23. | Other Injuries |
1,281
|
1.15
|
| 24. | Prostate Cancer |
1,248
|
1.12
|
| 25. | Liver Cancer |
1,026
|
0.92
|
| CAUSES OF DEATH | Deaths | % | |
| 26. | Homicide |
997
|
0.90
|
| 27. | Leukemia |
909
|
0.82
|
| 28. | Malnutrition |
814
|
0.73
|
| 29. | Oesophagus Cancer |
774
|
0.70
|
| 30. | Bladder Cancer |
721
|
0.65
|
| 31. | Other Neoplasms |
655
|
0.59
|
| 32. | Alcohol |
549
|
0.49
|
| 33. | Skin Cancers |
541
|
0.49
|
| 34. | Ovary Cancer |
516
|
0.46
|
| 35. | Oral Cancer |
478
|
0.43
|
| 36. | Uterin Cancer |
456
|
0.41
|
| 37. | Congenital Anomalies |
406
|
0.37
|
| 38. | Stomach Cancer |
351
|
0.32
|
| 39. | Diarrhoeal diseases |
281
|
0.25
|
| 40. | Skin Disease |
249
|
0.22
|
| 41. | Multiple Sclerosis |
244
|
0.22
|
| 42. | Low Birth Weight |
196
|
0.18
|
| 43. | Rheumatic/Heart |
156
|
0.14
|
| 44. | Peptic Ulcer Disease |
154
|
0.14
|
| 45. | Drug Use |
151
|
0.14
|
| 46. | Cervical Cancer |
150
|
0.13
|
| 47. | Epilepsy |
131
|
0.12
|
| 48. | Anaemia |
130
|
0.12
|
| 49. | Fires |
123
|
0.11
|
| 50. | Drownings |
115
|
0.10
|

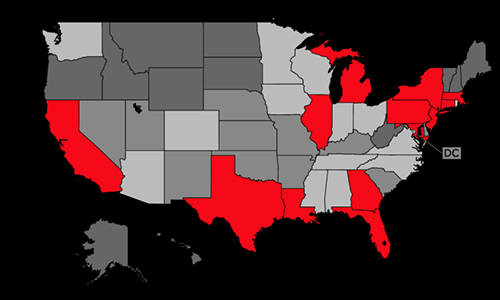
AGE-STANDARDIZED DEATH RATE: CDC 12/22
PER 100,000 POPULATION
GOOD
POOR
| Rate | USA Rank | ||
| 1. | Lung Cancers |
39.43
|
10
|
| 2. | Breast Cancer |
20.28
|
18
|
| 3. | Prostate Cancer |
19.89
|
24
|
| 4. | Colon-Rectum Cancers |
14.42
|
15
|
| 5. | Pancreas Cancer |
11.78
|
21
|
| 6. | Lymphomas |
9.17
|
16
|
| 7. | Liver Cancer |
6.49
|
29
|
| 8. | Leukemia |
6.19
|
18
|
| Rate | USA Rank | ||
| 9. | Ovary Cancer |
6.14
|
23
|
| 10. | Uterin Cancer |
5.43
|
21
|
| 11. | Oesophagus Cancer |
4.93
|
6
|
| 12. | Bladder Cancer |
4.81
|
10
|
| 13. | Skin Cancers |
3.65
|
13
|
| 14. | Oral Cancer |
3.05
|
18
|
| 15. | Stomach Cancer |
2.39
|
31
|
| 16. | Cervical Cancer |
2.36
|
20
|
DEATH RATE HISTORY SELECTED CAUSES

| Date | Rate | Total | Population |
| 1999 | 285.66 | 33,192 | 11,335,454 |
| 2000 | 279.17 | 32,722 | 11,353,140 |
| 2001 | 273.51 | 32,453 | 11,387,404 |
| 2002 | 261.17 | 31,388 | 11,407,889 |
| 2003 | 251.17 | 30,667 | 11,434,788 |
| 2004 | 235.82 | 29,078 | 11,452,251 |
| 2005 | 231.91 | 29,003 | 11,463,320 |
| 2006 | 218.53 | 27,886 | 11,481,213 |
| 2007 | 205.65 | 26,757 | 11,500,468 |
| 2008 | 206.93 | 27,324 | 11,515,391 |
| 2009 | 189.97 | 25,453 | 11,528,896 |
| 2010 | 192.41 | 26,164 | 11,536,504 |
| 2011 | 189.96 | 26,298 | 11,544,951 |
| 2012 | 187.73 | 26,426 | 11,544,225 |
| 2013 | 187.92 | 26,878 | 11,570,808 |
| 2014 | 186.38 | 27,000 | 11,594,163 |
| 2015 | 191.65 | 28,069 | 11,613,423 |
| 2016 | 185.08 | 27,410 | 11,614,373 |
| 2017 | 186.19 | 28,008 | 11,658,609 |
| 2018 | 191.12 | 29,220 | 11,689,442 |
| 2019 | 188.77 | 29,160 | 11,689,100 |
| 2020 | 196.86 | 30,547 | 11,693,217 |
| 2021 | 204.71 | 30,578 | 11,780,017 |

| Date | Rate | Total | Population |
| 1999 | 215.41 | 25,233 | 11,335,454 |
| 2000 | 212.00 | 24,988 | 11,353,140 |
| 2001 | 208.41 | 24,804 | 11,387,404 |
| 2002 | 208.96 | 25,173 | 11,407,889 |
| 2003 | 205.27 | 25,076 | 11,434,788 |
| 2004 | 202.13 | 24,940 | 11,452,251 |
| 2005 | 198.07 | 24,702 | 11,463,320 |
| 2006 | 197.30 | 24,975 | 11,481,213 |
| 2007 | 196.33 | 25,230 | 11,500,468 |
| 2008 | 191.92 | 24,998 | 11,515,391 |
| 2009 | 190.52 | 25,149 | 11,528,896 |
| 2010 | 187.74 | 25,083 | 11,536,504 |
| 2011 | 184.92 | 25,140 | 11,544,951 |
| 2012 | 182.68 | 25,261 | 11,544,225 |
| 2013 | 177.63 | 24,986 | 11,570,808 |
| 2014 | 177.84 | 25,433 | 11,594,163 |
| 2015 | 175.11 | 25,396 | 11,613,423 |
| 2016 | 173.42 | 25,509 | 11,614,373 |
| 2017 | 171.23 | 25,643 | 11,658,609 |
| 2018 | 165.24 | 25,164 | 11,689,442 |
| 2019 | 163.00 | 25,170 | 11,689,100 |
| 2020 | 159.10 | 24,863 | 11,693,217 |
| 2021 | 162.99 | 25,077 | 11,780,017 |

| Date | Rate | Total | Population |
| 1999 | 62.30 | 7,235 | 11,335,454 |
| 2000 | 61.24 | 7,175 | 11,353,140 |
| 2001 | 58.06 | 6,891 | 11,387,404 |
| 2002 | 60.35 | 7,252 | 11,407,889 |
| 2003 | 56.56 | 6,910 | 11,434,788 |
| 2004 | 52.77 | 6,501 | 11,452,251 |
| 2005 | 50.19 | 6,279 | 11,463,320 |
| 2006 | 45.68 | 5,828 | 11,481,213 |
| 2007 | 45.48 | 5,905 | 11,500,468 |
| 2008 | 45.24 | 5,951 | 11,515,391 |
| 2009 | 41.83 | 5,576 | 11,528,896 |
| 2010 | 42.57 | 5,755 | 11,536,504 |
| 2011 | 41.34 | 5,691 | 11,544,951 |
| 2012 | 41.24 | 5,788 | 11,544,225 |
| 2013 | 39.93 | 5,690 | 11,570,808 |
| 2014 | 40.03 | 5,791 | 11,594,163 |
| 2015 | 40.67 | 5,945 | 11,613,423 |
| 2016 | 40.61 | 5,987 | 11,614,373 |
| 2017 | 42.84 | 6,425 | 11,658,609 |
| 2018 | 42.59 | 6,525 | 11,689,442 |
| 2019 | 42.15 | 6,504 | 11,689,100 |
| 2020 | 45.35 | 7,053 | 11,693,217 |
| 2021 | 49.00 | 7,244 | 11,780,017 |

| Date | Rate | Total | Population |
| 1999 | 49.87 | 5,858 | 11,335,454 |
| 2000 | 50.62 | 5,983 | 11,353,140 |
| 2001 | 49.30 | 5,881 | 11,387,404 |
| 2002 | 50.24 | 6,063 | 11,407,889 |
| 2003 | 48.51 | 5,927 | 11,434,788 |
| 2004 | 47.84 | 5,896 | 11,452,251 |
| 2005 | 52.77 | 6,580 | 11,463,320 |
| 2006 | 47.89 | 6,054 | 11,481,213 |
| 2007 | 50.35 | 6,454 | 11,500,468 |
| 2008 | 53.31 | 6,928 | 11,515,391 |
| 2009 | 50.37 | 6,642 | 11,528,896 |
| 2010 | 50.47 | 6,717 | 11,536,504 |
| 2011 | 51.70 | 6,996 | 11,544,951 |
| 2012 | 51.22 | 7,070 | 11,544,225 |
| 2013 | 49.74 | 7,007 | 11,570,808 |
| 2014 | 47.21 | 6,765 | 11,594,163 |
| 2015 | 49.59 | 7,211 | 11,613,423 |
| 2016 | 47.53 | 7,015 | 11,614,373 |
| 2017 | 48.47 | 7,312 | 11,658,609 |
| 2018 | 48.99 | 7,518 | 11,689,442 |
| 2019 | 45.90 | 7,170 | 11,689,100 |
| 2020 | 44.64 | 7,042 | 11,693,217 |
| 2021 | 41.77 | 6,437 | 11,780,017 |

| Date | Rate | Total | Population |
| 1999 | 31.82 | 3,630 | 11,335,454 |
| 2000 | 30.53 | 3,492 | 11,353,140 |
| 2001 | 33.42 | 3,857 | 11,387,404 |
| 2002 | 35.79 | 4,146 | 11,407,889 |
| 2003 | 32.16 | 3,757 | 11,434,788 |
| 2004 | 36.09 | 4,234 | 11,452,251 |
| 2005 | 37.70 | 4,438 | 11,463,320 |
| 2006 | 40.51 | 4,821 | 11,481,213 |
| 2007 | 41.29 | 4,922 | 11,500,468 |
| 2008 | 42.29 | 5,093 | 11,515,391 |
| 2009 | 33.14 | 4,012 | 11,528,896 |
| 2010 | 42.36 | 5,124 | 11,536,504 |
| 2011 | 43.44 | 5,275 | 11,544,951 |
| 2012 | 44.66 | 5,420 | 11,544,225 |
| 2013 | 45.03 | 5,497 | 11,570,808 |
| 2014 | 50.80 | 6,178 | 11,594,163 |
| 2015 | 55.95 | 6,756 | 11,613,423 |
| 2016 | 66.56 | 7,999 | 11,614,373 |
| 2017 | 75.06 | 8,971 | 11,658,609 |
| 2018 | 63.76 | 7,755 | 11,689,442 |
| 2019 | 67.69 | 8,287 | 11,689,100 |
| 2020 | 78.23 | 9,436 | 11,693,217 |
| 2021 | 81.91 | 9,919 | 11,780,017 |

| Date | Rate | Total | Population |
| 1999 | 31.41 | 3,675 | 11,335,454 |
| 2000 | 31.35 | 3,691 | 11,353,140 |
| 2001 | 31.53 | 3,750 | 11,387,404 |
| 2002 | 31.95 | 3,846 | 11,407,889 |
| 2003 | 30.59 | 3,731 | 11,434,788 |
| 2004 | 29.33 | 3,615 | 11,452,251 |
| 2005 | 30.47 | 3,794 | 11,463,320 |
| 2006 | 29.64 | 3,761 | 11,481,213 |
| 2007 | 28.96 | 3,722 | 11,500,468 |
| 2008 | 27.23 | 3,565 | 11,515,391 |
| 2009 | 25.74 | 3,401 | 11,528,896 |
| 2010 | 25.82 | 3,470 | 11,536,504 |
| 2011 | 26.82 | 3,668 | 11,544,951 |
| 2012 | 26.13 | 3,618 | 11,544,225 |
| 2013 | 25.44 | 3,563 | 11,570,808 |
| 2014 | 25.68 | 3,641 | 11,594,163 |
| 2015 | 25.26 | 3,645 | 11,613,423 |
| 2016 | 24.57 | 3,568 | 11,614,373 |
| 2017 | 25.19 | 3,740 | 11,658,609 |
| 2018 | 25.38 | 3,845 | 11,689,442 |
| 2019 | 25.40 | 3,873 | 11,689,100 |
| 2020 | 28.35 | 4,382 | 11,693,217 |
| 2021 | 29.55 | 4,461 | 11,780,017 |

| Date | Rate | Total | Population |
| 1999 | 18.21 | 2,099 | 11,335,454 |
| 2000 | 19.65 | 2,295 | 11,353,140 |
| 2001 | 19.98 | 2,367 | 11,387,404 |
| 2002 | 21.66 | 2,599 | 11,407,889 |
| 2003 | 23.74 | 2,902 | 11,434,788 |
| 2004 | 23.69 | 2,927 | 11,452,251 |
| 2005 | 27.69 | 3,478 | 11,463,320 |
| 2006 | 27.70 | 3,565 | 11,481,213 |
| 2007 | 27.88 | 3,671 | 11,500,468 |
| 2008 | 31.97 | 4,285 | 11,515,391 |
| 2009 | 28.47 | 3,879 | 11,528,896 |
| 2010 | 29.73 | 4,109 | 11,536,504 |
| 2011 | 28.50 | 4,037 | 11,544,951 |
| 2012 | 27.37 | 3,935 | 11,544,225 |
| 2013 | 25.97 | 3,798 | 11,570,808 |
| 2014 | 27.65 | 4,083 | 11,594,163 |
| 2015 | 31.09 | 4,643 | 11,613,423 |
| 2016 | 33.41 | 5,031 | 11,614,373 |
| 2017 | 33.56 | 5,117 | 11,658,609 |
| 2018 | 34.88 | 5,391 | 11,689,442 |
| 2019 | 33.57 | 5,234 | 11,689,100 |
| 2020 | 38.04 | 5,955 | 11,693,217 |
| 2021 | 34.23 | 4,947 | 11,780,017 |

| Date | Rate | Total | Population |
| 1999 | 22.89 | 2,641 | 11,335,454 |
| 2000 | 21.74 | 2,533 | 11,353,140 |
| 2001 | 20.30 | 2,401 | 11,387,404 |
| 2002 | 20.77 | 2,487 | 11,407,889 |
| 2003 | 19.12 | 2,330 | 11,434,788 |
| 2004 | 17.89 | 2,204 | 11,452,251 |
| 2005 | 19.39 | 2,416 | 11,463,320 |
| 2006 | 15.27 | 1,947 | 11,481,213 |
| 2007 | 13.41 | 1,743 | 11,500,468 |
| 2008 | 15.84 | 2,085 | 11,515,391 |
| 2009 | 15.42 | 2,040 | 11,528,896 |
| 2010 | 14.57 | 1,975 | 11,536,504 |
| 2011 | 16.61 | 2,291 | 11,544,951 |
| 2012 | 15.54 | 2,195 | 11,544,225 |
| 2013 | 16.61 | 2,374 | 11,570,808 |
| 2014 | 16.88 | 2,443 | 11,594,163 |
| 2015 | 16.63 | 2,445 | 11,613,423 |
| 2016 | 15.00 | 2,187 | 11,614,373 |
| 2017 | 14.92 | 2,243 | 11,658,609 |
| 2018 | 15.68 | 2,395 | 11,689,442 |
| 2019 | 12.63 | 1,930 | 11,689,100 |
| 2020 | 13.33 | 2,043 | 11,693,217 |
| 2021 | 11.37 | 1,673 | 11,780,017 |

| Date | Rate | Total | Population |
| 1999 | 15.02 | 1,748 | 11,335,454 |
| 2000 | 15.57 | 1,829 | 11,353,140 |
| 2001 | 16.10 | 1,912 | 11,387,404 |
| 2002 | 16.87 | 2,027 | 11,407,889 |
| 2003 | 17.14 | 2,093 | 11,434,788 |
| 2004 | 15.39 | 1,896 | 11,452,251 |
| 2005 | 15.23 | 1,902 | 11,463,320 |
| 2006 | 13.87 | 1,758 | 11,481,213 |
| 2007 | 13.52 | 1,747 | 11,500,468 |
| 2008 | 14.27 | 1,865 | 11,515,391 |
| 2009 | 14.40 | 1,909 | 11,528,896 |
| 2010 | 15.37 | 2,066 | 11,536,504 |
| 2011 | 14.24 | 1,943 | 11,544,951 |
| 2012 | 14.78 | 2,056 | 11,544,225 |
| 2013 | 13.98 | 1,985 | 11,570,808 |
| 2014 | 14.06 | 2,002 | 11,594,163 |
| 2015 | 14.47 | 2,100 | 11,613,423 |
| 2016 | 15.39 | 2,262 | 11,614,373 |
| 2017 | 14.98 | 2,237 | 11,658,609 |
| 2018 | 14.50 | 2,202 | 11,689,442 |
| 2019 | 14.13 | 2,164 | 11,689,100 |
| 2020 | 14.06 | 2,186 | 11,693,217 |
| 2021 | 15.33 | 2,294 | 11,780,017 |

| Date | Rate | Total | Population |
| 1999 | 13.02 | 1,514 | 11,335,454 |
| 2000 | 13.05 | 1,527 | 11,353,140 |
| 2001 | 12.25 | 1,452 | 11,387,404 |
| 2002 | 13.56 | 1,627 | 11,407,889 |
| 2003 | 13.11 | 1,595 | 11,434,788 |
| 2004 | 12.11 | 1,488 | 11,452,251 |
| 2005 | 11.64 | 1,447 | 11,463,320 |
| 2006 | 9.93 | 1,254 | 11,481,213 |
| 2007 | 9.49 | 1,220 | 11,500,468 |
| 2008 | 11.18 | 1,454 | 11,515,391 |
| 2009 | 11.45 | 1,501 | 11,528,896 |
| 2010 | 11.25 | 1,504 | 11,536,504 |
| 2011 | 11.82 | 1,602 | 11,544,951 |
| 2012 | 11.71 | 1,616 | 11,544,225 |
| 2013 | 12.55 | 1,741 | 11,570,808 |
| 2014 | 12.15 | 1,729 | 11,594,163 |
| 2015 | 13.65 | 1,957 | 11,613,423 |
| 2016 | 13.73 | 1,995 | 11,614,373 |
| 2017 | 14.00 | 2,066 | 11,658,609 |
| 2018 | 13.82 | 2,078 | 11,689,442 |
| 2019 | 12.54 | 1,905 | 11,689,100 |
| 2020 | 13.31 | 2,046 | 11,693,217 |
| 2021 | 13.57 | 2,050 | 11,780,017 |

| Date | Rate | Total | Population |
| 1999 | 9.66 | 1,102 | 11,335,454 |
| 2000 | 9.53 | 1,088 | 11,353,140 |
| 2001 | 10.63 | 1,219 | 11,387,404 |
| 2002 | 11.18 | 1,287 | 11,407,889 |
| 2003 | 9.34 | 1,074 | 11,434,788 |
| 2004 | 11.37 | 1,319 | 11,452,251 |
| 2005 | 11.51 | 1,341 | 11,463,320 |
| 2006 | 11.29 | 1,325 | 11,481,213 |
| 2007 | 11.06 | 1,295 | 11,500,468 |
| 2008 | 12.15 | 1,412 | 11,515,391 |
| 2009 | 9.99 | 1,176 | 11,528,896 |
| 2010 | 12.24 | 1,439 | 11,536,504 |
| 2011 | 12.33 | 1,465 | 11,544,951 |
| 2012 | 13.02 | 1,542 | 11,544,225 |
| 2013 | 12.86 | 1,526 | 11,570,808 |
| 2014 | 12.55 | 1,491 | 11,594,163 |
| 2015 | 13.90 | 1,650 | 11,613,423 |
| 2016 | 14.16 | 1,707 | 11,614,373 |
| 2017 | 14.81 | 1,740 | 11,658,609 |
| 2018 | 15.26 | 1,838 | 11,689,442 |
| 2019 | 15.14 | 1,806 | 11,689,100 |
| 2020 | 13.76 | 1,644 | 11,693,217 |
| 2021 | 14.65 | 1,766 | 11,780,017 |

| Date | Rate | Total | Population |
| 1999 | 7.31 | 850 | 11,335,454 |
| 2000 | 7.41 | 868 | 11,353,140 |
| 2001 | 7.62 | 903 | 11,387,404 |
| 2002 | 7.88 | 944 | 11,407,889 |
| 2003 | 8.40 | 1,025 | 11,434,788 |
| 2004 | 9.28 | 1,143 | 11,452,251 |
| 2005 | 9.27 | 1,163 | 11,463,320 |
| 2006 | 9.09 | 1,164 | 11,481,213 |
| 2007 | 9.30 | 1,211 | 11,500,468 |
| 2008 | 9.26 | 1,229 | 11,515,391 |
| 2009 | 9.47 | 1,271 | 11,528,896 |
| 2010 | 8.88 | 1,220 | 11,536,504 |
| 2011 | 9.30 | 1,293 | 11,544,951 |
| 2012 | 8.89 | 1,267 | 11,544,225 |
| 2013 | 9.08 | 1,317 | 11,570,808 |
| 2014 | 9.30 | 1,361 | 11,594,163 |
| 2015 | 9.48 | 1,395 | 11,613,423 |
| 2016 | 9.29 | 1,396 | 11,614,373 |
| 2017 | 9.14 | 1,383 | 11,658,609 |
| 2018 | 9.10 | 1,404 | 11,689,442 |
| 2019 | 8.94 | 1,395 | 11,689,100 |
| 2020 | 9.95 | 1,545 | 11,693,217 |
| 2021 | 10.17 | 1,526 | 11,780,017 |

| Date | Rate | Total | Population |
| 1999 | 8.67 | 1,007 | 11,335,454 |
| 2000 | 8.52 | 994 | 11,353,140 |
| 2001 | 8.68 | 1,027 | 11,387,404 |
| 2002 | 8.75 | 1,047 | 11,407,889 |
| 2003 | 8.59 | 1,043 | 11,434,788 |
| 2004 | 8.70 | 1,063 | 11,452,251 |
| 2005 | 8.82 | 1,105 | 11,463,320 |
| 2006 | 8.61 | 1,096 | 11,481,213 |
| 2007 | 8.98 | 1,152 | 11,500,468 |
| 2008 | 9.18 | 1,198 | 11,515,391 |
| 2009 | 8.88 | 1,167 | 11,528,896 |
| 2010 | 9.40 | 1,244 | 11,536,504 |
| 2011 | 9.64 | 1,311 | 11,544,951 |
| 2012 | 9.63 | 1,318 | 11,544,225 |
| 2013 | 10.14 | 1,396 | 11,570,808 |
| 2014 | 10.38 | 1,456 | 11,594,163 |
| 2015 | 10.72 | 1,506 | 11,613,423 |
| 2016 | 10.90 | 1,558 | 11,614,373 |
| 2017 | 11.23 | 1,603 | 11,658,609 |
| 2018 | 10.59 | 1,521 | 11,689,442 |
| 2019 | 11.14 | 1,622 | 11,689,100 |
| 2020 | 12.48 | 1,798 | 11,693,217 |
| 2021 | 14.22 | 2,021 | 11,780,017 |

| Date | Rate | Total | Population |
| 1999 | 5.55 | 649 | 11,335,454 |
| 2000 | 5.71 | 673 | 11,353,140 |
| 2001 | 5.69 | 679 | 11,387,404 |
| 2002 | 6.63 | 802 | 11,407,889 |
| 2003 | 6.75 | 826 | 11,434,788 |
| 2004 | 6.28 | 776 | 11,452,251 |
| 2005 | 6.97 | 869 | 11,463,320 |
| 2006 | 7.12 | 901 | 11,481,213 |
| 2007 | 6.79 | 870 | 11,500,468 |
| 2008 | 6.74 | 875 | 11,515,391 |
| 2009 | 6.95 | 909 | 11,528,896 |
| 2010 | 6.92 | 920 | 11,536,504 |
| 2011 | 7.21 | 973 | 11,544,951 |
| 2012 | 7.52 | 1,028 | 11,544,225 |
| 2013 | 7.87 | 1,088 | 11,570,808 |
| 2014 | 7.79 | 1,094 | 11,594,163 |
| 2015 | 8.04 | 1,139 | 11,613,423 |
| 2016 | 8.65 | 1,248 | 11,614,373 |
| 2017 | 8.74 | 1,297 | 11,658,609 |
| 2018 | 9.65 | 1,439 | 11,689,442 |
| 2019 | 9.66 | 1,470 | 11,689,100 |
| 2020 | 10.76 | 1,651 | 11,693,217 |
| 2021 | 10.15 | 1,489 | 11,780,017 |

| Date | Rate | Total | Population |
| 1999 | 4.00 | 450 | 11,335,454 |
| 2000 | 4.12 | 465 | 11,353,140 |
| 2001 | 4.67 | 524 | 11,387,404 |
| 2002 | 4.89 | 549 | 11,407,889 |
| 2003 | 4.65 | 520 | 11,434,788 |
| 2004 | 5.00 | 563 | 11,452,251 |
| 2005 | 5.62 | 630 | 11,463,320 |
| 2006 | 5.99 | 666 | 11,481,213 |
| 2007 | 5.74 | 639 | 11,500,468 |
| 2008 | 5.41 | 598 | 11,515,391 |
| 2009 | 4.84 | 541 | 11,528,896 |
| 2010 | 5.12 | 569 | 11,536,504 |
| 2011 | 5.57 | 618 | 11,544,951 |
| 2012 | 5.74 | 632 | 11,544,225 |
| 2013 | 5.90 | 648 | 11,570,808 |
| 2014 | 5.22 | 578 | 11,594,163 |
| 2015 | 6.02 | 669 | 11,613,423 |
| 2016 | 6.55 | 721 | 11,614,373 |
| 2017 | 7.55 | 828 | 11,658,609 |
| 2018 | 6.85 | 760 | 11,689,442 |
| 2019 | 6.59 | 724 | 11,689,100 |
| 2020 | 9.13 | 1,004 | 11,693,217 |
| 2021 | 9.32 | 1,020 | 11,780,017 |
CHOOSE NEW STATE
COVID-19 UPDATE
4/1/24
| CASES | DEATHS |
|
3,737,176
|
43,859
|
COVID-19 DEATH SIMULATOR
Current Covid-19 deaths compared to a simulated calendar based historical average of selected Ohio causes.

WITH STATE ADJUSTMENTS

WITH STATE ADJUSTMENTS

WITH STATE ADJUSTMENTS
Centers for Disease Control and Prevention: Final Deaths 2021 Release Date 12/22.


