HEALTH RANKINGS Alaska

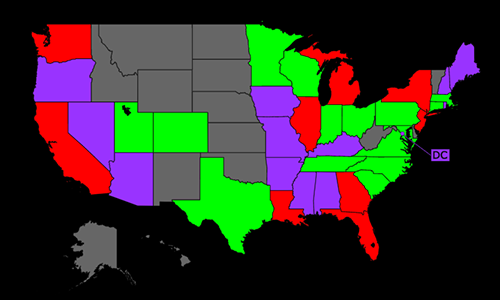
AGE-STANDARDIZED DEATH RATE: CDC 12/22
PER 100,000 POPULATION
GOOD
POOR
| CAUSES OF DEATH | Rate | USA Rank | |
| 1. | COVID-19 |
109.51
|
19
|
| 2. | Coronary Heart Disease |
71.76
|
44
|
| 3. | Stroke |
42.30
|
22
|
| 4. | Poisonings |
38.10
|
17
|
| 5. | Lung Cancers |
33.12
|
23
|
| 6. | Lung Disease |
32.59
|
32
|
| 7. | Suicide |
30.83
|
3
|
| 8. | Diabetes Mellitus |
27.02
|
17
|
| 9. | Alzheimers |
26.39
|
37
|
| 10. | Hypertension |
24.43
|
37
|
| 11. | Liver Disease |
24.40
|
5
|
| 12. | Prostate Cancer |
22.75
|
6
|
| 13. | Breast Cancer |
18.98
|
34
|
| 14. | Endocrine Disorders |
18.13
|
10
|
| 15. | Kidney Disease |
14.81
|
19
|
| 16. | Alcohol |
14.13
|
2
|
| 17. | Colon-Rectum Cancers |
12.93
|
34
|
| 18. | Falls |
12.84
|
24
|
| 19. | Inflammatory/Heart |
9.87
|
2
|
| 20. | Lymphomas |
8.89
|
20
|
| CAUSES OF DEATH | Rate | USA Rank | |
| 21. | Pancreas Cancer |
8.53
|
51
|
| 22. | Parkinson's Disease |
7.74
|
48
|
| 23. | Liver Cancer |
7.49
|
9
|
| 24. | Influenza & Pneumonia |
7.38
|
45
|
| 25. | Ovary Cancer |
6.94
|
5
|
| 26. | Homicide |
6.40
|
28
|
| 27. | Leukemia |
6.21
|
17
|
| 28. | Stomach Cancer |
4.87
|
1
|
| 29. | Oesophagus Cancer |
4.55
|
12
|
| 30. | Bladder Cancer |
4.30
|
22
|
| 31. | Other Neoplasms |
4.25
|
27
|
| 32. | Drownings |
3.85
|
1
|
| 33. | Oral Cancer |
3.55
|
5
|
| 34. | Congenital Anomalies |
3.37
|
22
|
| 35. | Drug Use |
0.00
|
0
|
| 36. | HIV/AIDS |
0.00
|
0
|
| 37. | Low Birth Weight |
0.00
|
0
|
| 38. | Cervical Cancer |
0.00
|
0
|
| 39. | Uterin Cancer |
0.00
|
0
|
| 40. | Skin Cancers |
0.00
|
0
|

PERCENT TOP 50 CAUSES: CDC 12/22
| CAUSES OF DEATH | Deaths | % | |
| 1. | COVID-19 |
761
|
18.35
|
| 2. | Coronary Heart Disease |
475
|
11.45
|
| 3. | Poisonings |
276
|
6.65
|
| 4. | Stroke |
243
|
5.86
|
| 5. | Lung Cancers |
229
|
5.52
|
| 6. | Lung Disease |
218
|
5.26
|
| 7. | Suicide |
217
|
5.23
|
| 8. | Liver Disease |
182
|
4.39
|
| 9. | Diabetes Mellitus |
177
|
4.27
|
| 10. | Hypertension |
165
|
3.98
|
| 11. | Alzheimers |
131
|
3.16
|
| 12. | Endocrine Disorders |
118
|
2.84
|
| 13. | Alcohol |
103
|
2.48
|
| 14. | Other Injuries |
92
|
2.22
|
| 15. | Colon-Rectum Cancers |
71
|
1.71
|
| 16. | Kidney Disease |
69
|
1.66
|
| 17. | Road Traffic Accidents |
64
|
1.54
|
| 18. | Breast Cancer |
62
|
1.49
|
| 19. | Prostate Cancer |
59
|
1.42
|
| 20. | Falls |
59
|
1.42
|
| 21. | Pancreas Cancer |
52
|
1.25
|
| 22. | Liver Cancer |
51
|
1.23
|
| 23. | Lymphomas |
49
|
1.18
|
| 24. | Parkinson's Disease |
43
|
1.04
|
| 25. | Inflammatory/Heart |
41
|
0.99
|
| CAUSES OF DEATH | Deaths | % | |
| 26. | Oesophagus Cancer |
27
|
0.65
|
| 27. | Influenza & Pneumonia |
25
|
0.60
|
| 28. | Homicide |
20
|
0.48
|
| 29. | Congenital Anomalies |
17
|
0.41
|
| 30. | Leukemia |
15
|
0.36
|
| 31. | Stomach Cancer |
13
|
0.31
|
| 32. | Ovary Cancer |
12
|
0.29
|
| 33. | Malnutrition |
12
|
0.29
|
| 34. | Maternal Conditions |
0
|
0.00
|
| 35. | Low Birth Weight |
0
|
0.00
|
| 36. | Birth Trauma |
0
|
0.00
|
| 37. | Iodine Deficiency |
0
|
0.00
|
| 38. | Vitamin A Deficiency |
0
|
0.00
|
| 39. | Otitis Media |
0
|
0.00
|
| 40. | Upper Respiratory |
0
|
0.00
|
| 41. | Tuberculosis |
0
|
0.00
|
| 42. | Hookworm Disease |
0
|
0.00
|
| 43. | Trichuriasis |
0
|
0.00
|
| 44. | Ascariasis |
0
|
0.00
|
| 45. | Encephalitis |
0
|
0.00
|
| 46. | Anaemia |
0
|
0.00
|
| 47. | Syphilis |
0
|
0.00
|
| 48. | Oral Cancer |
0
|
0.00
|
| 49. | Drug Use |
0
|
0.00
|
| 50. | Multiple Sclerosis |
0
|
0.00
|

AGE-STANDARDIZED DEATH RATE: CDC 12/22
PER 100,000 POPULATION
GOOD
POOR
| Rate | USA Rank | ||
| 1. | Lung Cancers |
33.12
|
23
|
| 2. | Prostate Cancer |
22.75
|
6
|
| 3. | Breast Cancer |
18.98
|
34
|
| 4. | Colon-Rectum Cancers |
12.93
|
34
|
| 5. | Lymphomas |
8.89
|
20
|
| 6. | Pancreas Cancer |
8.53
|
51
|
| 7. | Liver Cancer |
7.49
|
9
|
| 8. | Ovary Cancer |
6.94
|
5
|
| Rate | USA Rank | ||
| 9. | Leukemia |
6.21
|
17
|
| 10. | Stomach Cancer |
4.87
|
1
|
| 11. | Oesophagus Cancer |
4.55
|
12
|
| 12. | Bladder Cancer |
4.30
|
22
|
| 13. | Oral Cancer |
3.55
|
5
|
| 14. | Cervical Cancer |
0.00
|
0
|
| 15. | Uterin Cancer |
0.00
|
0
|
| 16. | Skin Cancers |
0.00
|
0
|
DEATH RATE HISTORY SELECTED CAUSES

| Date | Rate | Total | Population |
| 1999 | 198.02 | 563 | 624,779 |
| 2000 | 211.74 | 607 | 626,932 |
| 2001 | 189.10 | 603 | 633,714 |
| 2002 | 169.31 | 567 | 642,337 |
| 2003 | 185.52 | 626 | 648,414 |
| 2004 | 160.11 | 589 | 659,286 |
| 2005 | 166.11 | 627 | 666,946 |
| 2006 | 170.63 | 645 | 675,302 |
| 2007 | 154.17 | 613 | 680,300 |
| 2008 | 150.13 | 634 | 687,455 |
| 2009 | 158.90 | 714 | 698,895 |
| 2010 | 151.46 | 707 | 710,231 |
| 2011 | 149.59 | 739 | 722,718 |
| 2012 | 136.51 | 708 | 731,449 |
| 2013 | 134.96 | 706 | 735,132 |
| 2014 | 146.63 | 782 | 736,732 |
| 2015 | 154.11 | 846 | 738,432 |
| 2016 | 141.04 | 831 | 741,894 |
| 2017 | 135.04 | 814 | 739,795 |
| 2018 | 129.72 | 815 | 737,438 |
| 2019 | 129.72 | 843 | 731,545 |
| 2020 | 139.84 | 915 | 731,158 |
| 2021 | 154.67 | 1,011 | 732,673 |

| Date | Rate | Total | Population |
| 1999 | 190.54 | 633 | 624,779 |
| 2000 | 208.20 | 704 | 626,932 |
| 2001 | 193.73 | 689 | 633,714 |
| 2002 | 189.84 | 715 | 642,337 |
| 2003 | 188.42 | 735 | 648,414 |
| 2004 | 184.23 | 728 | 659,286 |
| 2005 | 170.98 | 732 | 666,946 |
| 2006 | 177.76 | 790 | 675,302 |
| 2007 | 182.61 | 839 | 680,300 |
| 2008 | 181.05 | 867 | 687,455 |
| 2009 | 183.00 | 895 | 698,895 |
| 2010 | 176.92 | 884 | 710,231 |
| 2011 | 175.53 | 935 | 722,718 |
| 2012 | 166.45 | 925 | 731,449 |
| 2013 | 171.95 | 1,016 | 735,132 |
| 2014 | 164.23 | 972 | 736,732 |
| 2015 | 159.81 | 978 | 738,432 |
| 2016 | 158.66 | 995 | 741,894 |
| 2017 | 139.22 | 926 | 739,795 |
| 2018 | 141.55 | 957 | 737,438 |
| 2019 | 146.91 | 1,021 | 731,545 |
| 2020 | 143.75 | 1,043 | 731,158 |
| 2021 | 156.00 | 1,093 | 732,673 |

| Date | Rate | Total | Population |
| 1999 | 71.24 | 171 | 624,779 |
| 2000 | 66.08 | 170 | 626,932 |
| 2001 | 57.87 | 158 | 633,714 |
| 2002 | 55.97 | 158 | 642,337 |
| 2003 | 62.27 | 185 | 648,414 |
| 2004 | 52.77 | 172 | 659,286 |
| 2005 | 54.88 | 178 | 666,946 |
| 2006 | 48.19 | 177 | 675,302 |
| 2007 | 47.04 | 157 | 680,300 |
| 2008 | 44.51 | 172 | 687,455 |
| 2009 | 41.83 | 162 | 698,895 |
| 2010 | 40.85 | 167 | 710,231 |
| 2011 | 39.41 | 168 | 722,718 |
| 2012 | 42.53 | 188 | 731,449 |
| 2013 | 40.72 | 189 | 735,132 |
| 2014 | 32.30 | 157 | 736,732 |
| 2015 | 36.84 | 182 | 738,432 |
| 2016 | 39.03 | 196 | 741,894 |
| 2017 | 35.05 | 190 | 739,795 |
| 2018 | 40.01 | 216 | 737,438 |
| 2019 | 34.90 | 210 | 731,545 |
| 2020 | 34.21 | 212 | 731,158 |
| 2021 | 42.30 | 253 | 732,673 |

| Date | Rate | Total | Population |
| 1999 | 56.36 | 146 | 624,779 |
| 2000 | 47.63 | 132 | 626,932 |
| 2001 | 49.89 | 147 | 633,714 |
| 2002 | 47.52 | 142 | 642,337 |
| 2003 | 46.93 | 147 | 648,414 |
| 2004 | 39.52 | 139 | 659,286 |
| 2005 | 42.68 | 158 | 666,946 |
| 2006 | 37.75 | 140 | 675,302 |
| 2007 | 45.47 | 175 | 680,300 |
| 2008 | 44.55 | 181 | 687,455 |
| 2009 | 49.67 | 196 | 698,895 |
| 2010 | 41.48 | 176 | 710,231 |
| 2011 | 41.80 | 194 | 722,718 |
| 2012 | 40.87 | 189 | 731,449 |
| 2013 | 37.88 | 197 | 735,132 |
| 2014 | 38.78 | 192 | 736,732 |
| 2015 | 37.76 | 204 | 738,432 |
| 2016 | 41.51 | 238 | 741,894 |
| 2017 | 35.90 | 204 | 739,795 |
| 2018 | 35.28 | 222 | 737,438 |
| 2019 | 30.36 | 202 | 731,545 |
| 2020 | 30.99 | 205 | 731,158 |
| 2021 | 35.01 | 237 | 732,673 |

| Date | Rate | Total | Population |
| 1999 | 55.91 | 294 | 624,779 |
| 2000 | 64.48 | 343 | 626,932 |
| 2001 | 60.54 | 345 | 633,714 |
| 2002 | 59.16 | 346 | 642,337 |
| 2003 | 55.39 | 321 | 648,414 |
| 2004 | 56.02 | 326 | 659,286 |
| 2005 | 50.77 | 313 | 666,946 |
| 2006 | 52.30 | 316 | 675,302 |
| 2007 | 56.35 | 354 | 680,300 |
| 2008 | 54.08 | 332 | 687,455 |
| 2009 | 53.28 | 340 | 698,895 |
| 2010 | 58.66 | 366 | 710,231 |
| 2011 | 57.29 | 385 | 722,718 |
| 2012 | 54.13 | 368 | 731,449 |
| 2013 | 52.45 | 353 | 735,132 |
| 2014 | 54.96 | 379 | 736,732 |
| 2015 | 57.86 | 388 | 738,432 |
| 2016 | 63.14 | 439 | 741,894 |
| 2017 | 63.74 | 436 | 739,795 |
| 2018 | 56.43 | 400 | 737,438 |
| 2019 | 62.18 | 434 | 731,545 |
| 2020 | 65.47 | 464 | 731,158 |
| 2021 | 84.50 | 591 | 732,673 |

| Date | Rate | Total | Population |
| 1999 | 23.84 | 67 | 624,779 |
| 2000 | 27.30 | 87 | 626,932 |
| 2001 | 22.76 | 80 | 633,714 |
| 2002 | 22.02 | 86 | 642,337 |
| 2003 | 27.70 | 102 | 648,414 |
| 2004 | 22.55 | 93 | 659,286 |
| 2005 | 22.40 | 93 | 666,946 |
| 2006 | 25.94 | 109 | 675,302 |
| 2007 | 24.09 | 105 | 680,300 |
| 2008 | 22.26 | 93 | 687,455 |
| 2009 | 18.05 | 84 | 698,895 |
| 2010 | 19.58 | 86 | 710,231 |
| 2011 | 20.55 | 107 | 722,718 |
| 2012 | 18.83 | 107 | 731,449 |
| 2013 | 20.08 | 112 | 735,132 |
| 2014 | 19.37 | 113 | 736,732 |
| 2015 | 23.91 | 142 | 738,432 |
| 2016 | 19.25 | 124 | 741,894 |
| 2017 | 19.29 | 130 | 739,795 |
| 2018 | 17.67 | 122 | 737,438 |
| 2019 | 16.22 | 111 | 731,545 |
| 2020 | 24.85 | 174 | 731,158 |
| 2021 | 27.02 | 184 | 732,673 |

| Date | Rate | Total | Population |
| 1999 | 11.93 | 24 | 624,779 |
| 2000 | 21.49 | 47 | 626,932 |
| 2001 | 18.94 | 44 | 633,714 |
| 2002 | 25.77 | 61 | 642,337 |
| 2003 | 22.91 | 56 | 648,414 |
| 2004 | 18.00 | 48 | 659,286 |
| 2005 | 22.15 | 61 | 666,946 |
| 2006 | 25.91 | 73 | 675,302 |
| 2007 | 22.44 | 65 | 680,300 |
| 2008 | 27.04 | 80 | 687,455 |
| 2009 | 21.47 | 67 | 698,895 |
| 2010 | 25.91 | 85 | 710,231 |
| 2011 | 20.46 | 72 | 722,718 |
| 2012 | 27.21 | 102 | 731,449 |
| 2013 | 18.86 | 72 | 735,132 |
| 2014 | 17.24 | 68 | 736,732 |
| 2015 | 16.74 | 68 | 738,432 |
| 2016 | 25.81 | 111 | 741,894 |
| 2017 | 22.05 | 98 | 739,795 |
| 2018 | 27.49 | 131 | 737,438 |
| 2019 | 25.35 | 128 | 731,545 |
| 2020 | 26.83 | 139 | 731,158 |
| 2021 | 26.39 | 135 | 732,673 |

| Date | Rate | Total | Population |
| 1999 | 19.57 | 46 | 624,779 |
| 2000 | 16.04 | 45 | 626,932 |
| 2001 | 13.07 | 36 | 633,714 |
| 2002 | 19.51 | 51 | 642,337 |
| 2003 | 21.18 | 60 | 648,414 |
| 2004 | 15.12 | 42 | 659,286 |
| 2005 | 12.65 | 44 | 666,946 |
| 2006 | 13.96 | 49 | 675,302 |
| 2007 | 13.68 | 48 | 680,300 |
| 2008 | 13.21 | 51 | 687,455 |
| 2009 | 12.51 | 51 | 698,895 |
| 2010 | 15.84 | 64 | 710,231 |
| 2011 | 12.61 | 58 | 722,718 |
| 2012 | 9.98 | 52 | 731,449 |
| 2013 | 14.06 | 66 | 735,132 |
| 2014 | 14.11 | 68 | 736,732 |
| 2015 | 8.41 | 41 | 738,432 |
| 2016 | 12.55 | 61 | 741,894 |
| 2017 | 11.71 | 66 | 739,795 |
| 2018 | 12.13 | 68 | 737,438 |
| 2019 | 7.07 | 45 | 731,545 |
| 2020 | 8.01 | 52 | 731,158 |
| 2021 | 7.23 | 42 | 732,673 |

| Date | Rate | Total | Population |
| 1999 | 13.40 | 34 | 624,779 |
| 2000 | 11.62 | 30 | 626,932 |
| 2001 | 7.24 | 24 | 633,714 |
| 2002 | 6.78 | 21 | 642,337 |
| 2003 | 8.36 | 28 | 648,414 |
| 2004 | 7.10 | 23 | 659,286 |
| 2005 | 10.50 | 38 | 666,946 |
| 2006 | 12.91 | 44 | 675,302 |
| 2007 | 11.09 | 40 | 680,300 |
| 2008 | 13.49 | 50 | 687,455 |
| 2009 | 12.74 | 47 | 698,895 |
| 2010 | 13.49 | 56 | 710,231 |
| 2011 | 12.51 | 53 | 722,718 |
| 2012 | 9.48 | 44 | 731,449 |
| 2013 | 10.07 | 49 | 735,132 |
| 2014 | 10.08 | 45 | 736,732 |
| 2015 | 9.96 | 50 | 738,432 |
| 2016 | 10.04 | 53 | 741,894 |
| 2017 | 9.92 | 54 | 739,795 |
| 2018 | 8.08 | 46 | 737,438 |
| 2019 | 10.70 | 62 | 731,545 |
| 2020 | 10.84 | 66 | 731,158 |
| 2021 | 13.95 | 84 | 732,673 |

| Date | Rate | Total | Population |
| 1999 | 8.81 | 27 | 624,779 |
| 2000 | 0.00 | 17 | 626,932 |
| 2001 | 7.72 | 25 | 633,714 |
| 2002 | 7.77 | 25 | 642,337 |
| 2003 | 4.94 | 22 | 648,414 |
| 2004 | 0.00 | 19 | 659,286 |
| 2005 | 5.54 | 27 | 666,946 |
| 2006 | 6.99 | 25 | 675,302 |
| 2007 | 8.18 | 33 | 680,300 |
| 2008 | 5.00 | 23 | 687,455 |
| 2009 | 6.13 | 25 | 698,895 |
| 2010 | 7.74 | 36 | 710,231 |
| 2011 | 6.54 | 33 | 722,718 |
| 2012 | 8.64 | 44 | 731,449 |
| 2013 | 6.65 | 37 | 735,132 |
| 2014 | 7.15 | 43 | 736,732 |
| 2015 | 7.38 | 37 | 738,432 |
| 2016 | 7.83 | 47 | 741,894 |
| 2017 | 7.49 | 46 | 739,795 |
| 2018 | 7.11 | 43 | 737,438 |
| 2019 | 8.92 | 54 | 731,545 |
| 2020 | 9.72 | 65 | 731,158 |
| 2021 | 9.37 | 61 | 732,673 |

| Date | Rate | Total | Population |
| 1999 | 16.79 | 96 | 624,779 |
| 2000 | 21.47 | 137 | 626,932 |
| 2001 | 15.94 | 102 | 633,714 |
| 2002 | 20.77 | 132 | 642,337 |
| 2003 | 20.32 | 124 | 648,414 |
| 2004 | 23.02 | 155 | 659,286 |
| 2005 | 19.90 | 131 | 666,946 |
| 2006 | 19.91 | 135 | 675,302 |
| 2007 | 22.55 | 149 | 680,300 |
| 2008 | 24.35 | 169 | 687,455 |
| 2009 | 20.00 | 143 | 698,895 |
| 2010 | 22.78 | 164 | 710,231 |
| 2011 | 20.03 | 143 | 722,718 |
| 2012 | 23.03 | 168 | 731,449 |
| 2013 | 23.16 | 171 | 735,132 |
| 2014 | 22.06 | 167 | 736,732 |
| 2015 | 26.87 | 201 | 738,432 |
| 2016 | 25.79 | 193 | 741,894 |
| 2017 | 27.01 | 200 | 739,795 |
| 2018 | 24.56 | 184 | 737,438 |
| 2019 | 28.52 | 210 | 731,545 |
| 2020 | 27.46 | 204 | 731,158 |
| 2021 | 30.83 | 220 | 732,673 |

| Date | Rate | Total | Population |
| 1999 | 0.00 | 0 | 624,779 |
| 2000 | 0.00 | 12 | 626,932 |
| 2001 | 0.00 | 0 | 633,714 |
| 2002 | 0.00 | 0 | 642,337 |
| 2003 | 0.00 | 16 | 648,414 |
| 2004 | 0.00 | 14 | 659,286 |
| 2005 | 0.00 | 16 | 666,946 |
| 2006 | 6.53 | 20 | 675,302 |
| 2007 | 0.00 | 15 | 680,300 |
| 2008 | 0.00 | 16 | 687,455 |
| 2009 | 0.00 | 19 | 698,895 |
| 2010 | 6.36 | 25 | 710,231 |
| 2011 | 6.62 | 29 | 722,718 |
| 2012 | 5.63 | 27 | 731,449 |
| 2013 | 6.93 | 35 | 735,132 |
| 2014 | 5.78 | 33 | 736,732 |
| 2015 | 7.23 | 38 | 738,432 |
| 2016 | 5.59 | 30 | 741,894 |
| 2017 | 6.57 | 40 | 739,795 |
| 2018 | 8.15 | 50 | 737,438 |
| 2019 | 8.68 | 55 | 731,545 |
| 2020 | 8.43 | 55 | 731,158 |
| 2021 | 9.53 | 66 | 732,673 |

| Date | Rate | Total | Population |
| 1999 | 9.88 | 46 | 624,779 |
| 2000 | 9.60 | 45 | 626,932 |
| 2001 | 10.78 | 57 | 633,714 |
| 2002 | 9.52 | 55 | 642,337 |
| 2003 | 10.49 | 58 | 648,414 |
| 2004 | 8.14 | 47 | 659,286 |
| 2005 | 8.97 | 52 | 666,946 |
| 2006 | 7.14 | 46 | 675,302 |
| 2007 | 11.37 | 70 | 680,300 |
| 2008 | 9.24 | 60 | 687,455 |
| 2009 | 13.82 | 94 | 698,895 |
| 2010 | 9.83 | 70 | 710,231 |
| 2011 | 13.03 | 99 | 722,718 |
| 2012 | 12.57 | 89 | 731,449 |
| 2013 | 11.28 | 82 | 735,132 |
| 2014 | 10.68 | 84 | 736,732 |
| 2015 | 15.36 | 114 | 738,432 |
| 2016 | 16.26 | 124 | 741,894 |
| 2017 | 15.13 | 121 | 739,795 |
| 2018 | 15.61 | 121 | 737,438 |
| 2019 | 14.47 | 110 | 731,545 |
| 2020 | 22.36 | 167 | 731,158 |
| 2021 | 24.40 | 189 | 732,673 |

| Date | Rate | Total | Population |
| 1999 | 0.00 | 15 | 624,779 |
| 2000 | 0.00 | 19 | 626,932 |
| 2001 | 0.00 | 19 | 633,714 |
| 2002 | 0.00 | 18 | 642,337 |
| 2003 | 0.00 | 19 | 648,414 |
| 2004 | 0.00 | 17 | 659,286 |
| 2005 | 8.14 | 23 | 666,946 |
| 2006 | 10.00 | 29 | 675,302 |
| 2007 | 0.00 | 16 | 680,300 |
| 2008 | 0.00 | 19 | 687,455 |
| 2009 | 5.82 | 21 | 698,895 |
| 2010 | 9.22 | 32 | 710,231 |
| 2011 | 6.72 | 24 | 722,718 |
| 2012 | 7.65 | 30 | 731,449 |
| 2013 | 8.88 | 36 | 735,132 |
| 2014 | 5.52 | 23 | 736,732 |
| 2015 | 8.75 | 38 | 738,432 |
| 2016 | 0.00 | 18 | 741,894 |
| 2017 | 7.42 | 36 | 739,795 |
| 2018 | 9.52 | 51 | 737,438 |
| 2019 | 5.79 | 32 | 731,545 |
| 2020 | 7.88 | 47 | 731,158 |
| 2021 | 7.74 | 44 | 732,673 |

| Date | Rate | Total | Population |
| 1999 | 8.11 | 51 | 624,779 |
| 2000 | 5.64 | 37 | 626,932 |
| 2001 | 5.69 | 38 | 633,714 |
| 2002 | 5.86 | 40 | 642,337 |
| 2003 | 6.89 | 47 | 648,414 |
| 2004 | 6.06 | 41 | 659,286 |
| 2005 | 5.24 | 37 | 666,946 |
| 2006 | 6.20 | 43 | 675,302 |
| 2007 | 7.24 | 50 | 680,300 |
| 2008 | 4.42 | 29 | 687,455 |
| 2009 | 3.92 | 26 | 698,895 |
| 2010 | 6.08 | 44 | 710,231 |
| 2011 | 4.80 | 36 | 722,718 |
| 2012 | 4.99 | 38 | 731,449 |
| 2013 | 5.65 | 43 | 735,132 |
| 2014 | 4.70 | 37 | 736,732 |
| 2015 | 8.00 | 62 | 738,432 |
| 2016 | 7.34 | 54 | 741,894 |
| 2017 | 10.60 | 78 | 739,795 |
| 2018 | 7.54 | 56 | 737,438 |
| 2019 | 10.82 | 78 | 731,545 |
| 2020 | 7.32 | 55 | 731,158 |
| 2021 | 6.40 | 49 | 732,673 |
CHOOSE NEW STATE
COVID-19 UPDATE
4/1/24
| CASES | DEATHS |
|
301,513
|
1,485
|
COVID-19 DEATH SIMULATOR
Current Covid-19 deaths compared to a simulated calendar based historical average of selected Alaska causes.

WITH STATE ADJUSTMENTS

WITH STATE ADJUSTMENTS

WITH STATE ADJUSTMENTS
Centers for Disease Control and Prevention: Final Deaths 2021 Release Date 12/22.


