HEALTH RANKINGS New York

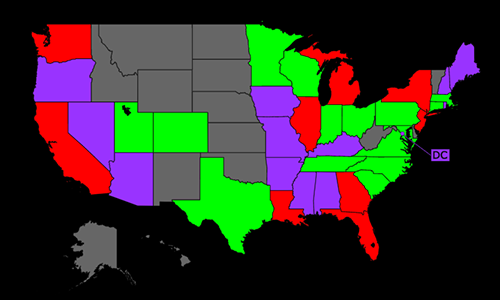
AGE-STANDARDIZED DEATH RATE: CDC 12/22
PER 100,000 POPULATION
GOOD
POOR
| CAUSES OF DEATH | Rate | USA Rank | |
| 1. | Coronary Heart Disease |
105.78
|
13
|
| 2. | COVID-19 |
83.89
|
30
|
| 3. | Hypertension |
30.14
|
24
|
| 4. | Poisonings |
27.22
|
32
|
| 5. | Stroke |
25.71
|
50
|
| 6. | Lung Cancers |
25.71
|
44
|
| 7. | Lung Disease |
21.25
|
48
|
| 8. | Diabetes Mellitus |
18.78
|
46
|
| 9. | Breast Cancer |
16.41
|
45
|
| 10. | Prostate Cancer |
14.52
|
51
|
| 11. | Influenza & Pneumonia |
14.49
|
6
|
| 12. | Endocrine Disorders |
13.70
|
44
|
| 13. | Alzheimers |
13.57
|
50
|
| 14. | Colon-Rectum Cancers |
11.37
|
46
|
| 15. | Pancreas Cancer |
10.99
|
38
|
| 16. | Kidney Disease |
10.31
|
38
|
| 17. | Liver Disease |
8.21
|
51
|
| 18. | Suicide |
7.94
|
49
|
| 19. | Falls |
7.66
|
47
|
| 20. | Lymphomas |
7.02
|
51
|
| CAUSES OF DEATH | Rate | USA Rank | |
| 21. | Parkinson's Disease |
6.69
|
51
|
| 22. | Ovary Cancer |
5.69
|
39
|
| 23. | Uterin Cancer |
5.65
|
13
|
| 24. | Liver Cancer |
5.34
|
43
|
| 25. | Inflammatory/Heart |
5.25
|
49
|
| 26. | Homicide |
4.84
|
34
|
| 27. | Leukemia |
4.73
|
48
|
| 28. | Other Neoplasms |
3.47
|
48
|
| 29. | Bladder Cancer |
3.29
|
50
|
| 30. | Stomach Cancer |
3.08
|
7
|
| 31. | Alcohol |
2.93
|
45
|
| 32. | Oesophagus Cancer |
2.92
|
47
|
| 33. | Congenital Anomalies |
2.42
|
43
|
| 34. | Skin Cancers |
2.19
|
49
|
| 35. | Oral Cancer |
2.14
|
45
|
| 36. | Cervical Cancer |
1.74
|
32
|
| 37. | HIV/AIDS |
1.66
|
11
|
| 38. | Low Birth Weight |
1.25
|
28
|
| 39. | Drownings |
0.74
|
42
|
| 40. | Drug Use |
0.72
|
33
|

PERCENT TOP 50 CAUSES: CDC 12/22
| CAUSES OF DEATH | Deaths | % | |
| 1. | Coronary Heart Disease |
27,810
|
20.18
|
| 2. | COVID-19 |
21,663
|
15.72
|
| 3. | Hypertension |
7,855
|
5.70
|
| 4. | Lung Cancers |
6,807
|
4.94
|
| 5. | Stroke |
6,676
|
4.84
|
| 6. | Lung Disease |
5,599
|
4.06
|
| 7. | Poisonings |
5,535
|
4.02
|
| 8. | Diabetes Mellitus |
4,839
|
3.51
|
| 9. | Influenza & Pneumonia |
3,753
|
2.72
|
| 10. | Alzheimers |
3,578
|
2.60
|
| 11. | Endocrine Disorders |
3,445
|
2.50
|
| 12. | Colon-Rectum Cancers |
2,898
|
2.10
|
| 13. | Pancreas Cancer |
2,894
|
2.10
|
| 14. | Kidney Disease |
2,661
|
1.93
|
| 15. | Breast Cancer |
2,318
|
1.68
|
| 16. | Falls |
1,977
|
1.43
|
| 17. | Liver Disease |
1,963
|
1.42
|
| 18. | Lymphomas |
1,796
|
1.30
|
| 19. | Parkinson's Disease |
1,711
|
1.24
|
| 20. | Suicide |
1,660
|
1.20
|
| 21. | Prostate Cancer |
1,560
|
1.13
|
| 22. | Liver Cancer |
1,403
|
1.02
|
| 23. | Road Traffic Accidents |
1,370
|
0.99
|
| 24. | Other Injuries |
1,297
|
0.94
|
| 25. | Inflammatory/Heart |
1,296
|
0.94
|
| CAUSES OF DEATH | Deaths | % | |
| 26. | Leukemia |
1,187
|
0.86
|
| 27. | Homicide |
902
|
0.65
|
| 28. | Other Neoplasms |
875
|
0.63
|
| 29. | Bladder Cancer |
862
|
0.63
|
| 30. | Uterin Cancer |
828
|
0.60
|
| 31. | Ovary Cancer |
810
|
0.59
|
| 32. | Stomach Cancer |
779
|
0.57
|
| 33. | Oesophagus Cancer |
769
|
0.56
|
| 34. | Alcohol |
669
|
0.49
|
| 35. | Skin Cancers |
566
|
0.41
|
| 36. | Oral Cancer |
559
|
0.41
|
| 37. | Skin Disease |
456
|
0.33
|
| 38. | Congenital Anomalies |
456
|
0.33
|
| 39. | Diarrhoeal diseases |
456
|
0.33
|
| 40. | Malnutrition |
436
|
0.32
|
| 41. | HIV/AIDS |
385
|
0.28
|
| 42. | Asthma |
232
|
0.17
|
| 43. | Multiple Sclerosis |
231
|
0.17
|
| 44. | Cervical Cancer |
209
|
0.15
|
| 45. | Peptic Ulcer Disease |
199
|
0.14
|
| 46. | Low Birth Weight |
190
|
0.14
|
| 47. | Rheumatic/Heart |
187
|
0.14
|
| 48. | Epilepsy |
186
|
0.13
|
| 49. | Fires |
145
|
0.11
|
| 50. | Drug Use |
143
|
0.10
|

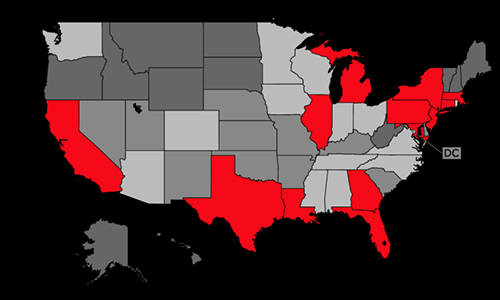
AGE-STANDARDIZED DEATH RATE: CDC 12/22
PER 100,000 POPULATION
GOOD
POOR
| Rate | USA Rank | ||
| 1. | Lung Cancers |
25.71
|
44
|
| 2. | Breast Cancer |
16.41
|
45
|
| 3. | Prostate Cancer |
14.52
|
51
|
| 4. | Colon-Rectum Cancers |
11.37
|
46
|
| 5. | Pancreas Cancer |
10.99
|
38
|
| 6. | Lymphomas |
7.02
|
51
|
| 7. | Ovary Cancer |
5.69
|
39
|
| 8. | Uterin Cancer |
5.65
|
13
|
| Rate | USA Rank | ||
| 9. | Liver Cancer |
5.34
|
43
|
| 10. | Leukemia |
4.73
|
48
|
| 11. | Bladder Cancer |
3.29
|
50
|
| 12. | Stomach Cancer |
3.08
|
7
|
| 13. | Oesophagus Cancer |
2.92
|
47
|
| 14. | Skin Cancers |
2.19
|
49
|
| 15. | Oral Cancer |
2.14
|
45
|
| 16. | Cervical Cancer |
1.74
|
32
|
DEATH RATE HISTORY SELECTED CAUSES

| Date | Rate | Total | Population |
| 1999 | 306.14 | 58,987 | 18,882,725 |
| 2000 | 293.82 | 57,474 | 18,976,457 |
| 2001 | 284.89 | 56,643 | 19,082,838 |
| 2002 | 281.43 | 56,672 | 19,137,800 |
| 2003 | 270.91 | 55,276 | 19,175,939 |
| 2004 | 254.59 | 52,480 | 19,171,567 |
| 2005 | 248.30 | 51,985 | 19,132,610 |
| 2006 | 238.24 | 50,470 | 19,104,631 |
| 2007 | 230.35 | 49,528 | 19,132,335 |
| 2008 | 225.77 | 49,324 | 19,212,436 |
| 2009 | 213.22 | 47,283 | 19,307,066 |
| 2010 | 199.95 | 44,981 | 19,378,102 |
| 2011 | 193.78 | 44,501 | 19,465,197 |
| 2012 | 186.54 | 43,795 | 19,570,261 |
| 2013 | 184.76 | 44,039 | 19,651,127 |
| 2014 | 178.30 | 43,116 | 19,746,227 |
| 2015 | 181.59 | 44,450 | 19,795,791 |
| 2016 | 177.83 | 44,076 | 19,745,289 |
| 2017 | 171.23 | 44,092 | 19,849,399 |
| 2018 | 171.88 | 44,499 | 19,542,209 |
| 2019 | 166.61 | 43,806 | 19,453,561 |
| 2020 | 183.86 | 48,546 | 19,336,776 |
| 2021 | 162.28 | 42,434 | 19,835,913 |

| Date | Rate | Total | Population |
| 1999 | 196.62 | 37,609 | 18,882,725 |
| 2000 | 192.22 | 37,198 | 18,976,457 |
| 2001 | 188.42 | 36,975 | 19,082,838 |
| 2002 | 184.44 | 36,661 | 19,137,800 |
| 2003 | 180.18 | 36,238 | 19,175,939 |
| 2004 | 177.77 | 36,100 | 19,171,567 |
| 2005 | 173.39 | 35,556 | 19,132,610 |
| 2006 | 170.88 | 35,284 | 19,104,631 |
| 2007 | 169.80 | 35,485 | 19,132,335 |
| 2008 | 166.91 | 35,351 | 19,212,436 |
| 2009 | 164.23 | 35,216 | 19,307,066 |
| 2010 | 163.14 | 35,431 | 19,378,102 |
| 2011 | 160.59 | 35,469 | 19,465,197 |
| 2012 | 159.44 | 35,882 | 19,570,261 |
| 2013 | 155.85 | 35,738 | 19,651,127 |
| 2014 | 151.84 | 35,392 | 19,746,227 |
| 2015 | 148.36 | 35,089 | 19,795,791 |
| 2016 | 147.47 | 35,368 | 19,745,289 |
| 2017 | 141.15 | 34,956 | 19,849,399 |
| 2018 | 138.21 | 34,491 | 19,542,209 |
| 2019 | 132.88 | 33,655 | 19,453,561 |
| 2020 | 128.83 | 32,955 | 19,336,776 |
| 2021 | 125.28 | 32,601 | 19,835,913 |

| Date | Rate | Total | Population |
| 1999 | 42.17 | 8,124 | 18,882,725 |
| 2000 | 40.93 | 8,006 | 18,976,457 |
| 2001 | 38.76 | 7,706 | 19,082,838 |
| 2002 | 37.90 | 7,625 | 19,137,800 |
| 2003 | 35.72 | 7,281 | 19,175,939 |
| 2004 | 33.73 | 6,927 | 19,171,567 |
| 2005 | 31.72 | 6,622 | 19,132,610 |
| 2006 | 30.40 | 6,398 | 19,104,631 |
| 2007 | 28.82 | 6,160 | 19,132,335 |
| 2008 | 28.22 | 6,123 | 19,212,436 |
| 2009 | 27.04 | 5,950 | 19,307,066 |
| 2010 | 27.91 | 6,213 | 19,378,102 |
| 2011 | 27.57 | 6,254 | 19,465,197 |
| 2012 | 26.59 | 6,139 | 19,570,261 |
| 2013 | 26.26 | 6,176 | 19,651,127 |
| 2014 | 26.09 | 6,212 | 19,746,227 |
| 2015 | 26.05 | 6,292 | 19,795,791 |
| 2016 | 25.54 | 6,258 | 19,745,289 |
| 2017 | 24.59 | 6,264 | 19,849,399 |
| 2018 | 24.39 | 6,244 | 19,542,209 |
| 2019 | 23.84 | 6,192 | 19,453,561 |
| 2020 | 24.81 | 6,486 | 19,336,776 |
| 2021 | 25.71 | 6,685 | 19,835,913 |

| Date | Rate | Total | Population |
| 1999 | 36.92 | 7,086 | 18,882,725 |
| 2000 | 34.89 | 6,784 | 18,976,457 |
| 2001 | 35.04 | 6,906 | 19,082,838 |
| 2002 | 34.91 | 6,966 | 19,137,800 |
| 2003 | 33.27 | 6,709 | 19,175,939 |
| 2004 | 33.35 | 6,786 | 19,171,567 |
| 2005 | 33.16 | 6,818 | 19,132,610 |
| 2006 | 30.50 | 6,329 | 19,104,631 |
| 2007 | 31.26 | 6,561 | 19,132,335 |
| 2008 | 32.58 | 6,919 | 19,212,436 |
| 2009 | 31.42 | 6,740 | 19,307,066 |
| 2010 | 31.44 | 6,847 | 19,378,102 |
| 2011 | 31.49 | 6,963 | 19,465,197 |
| 2012 | 31.06 | 7,034 | 19,570,261 |
| 2013 | 30.74 | 7,110 | 19,651,127 |
| 2014 | 29.05 | 6,806 | 19,746,227 |
| 2015 | 29.86 | 7,109 | 19,795,791 |
| 2016 | 28.40 | 6,860 | 19,745,289 |
| 2017 | 28.86 | 7,258 | 19,849,399 |
| 2018 | 28.53 | 7,270 | 19,542,209 |
| 2019 | 27.53 | 7,118 | 19,453,561 |
| 2020 | 25.47 | 6,645 | 19,336,776 |
| 2021 | 22.53 | 5,911 | 19,835,913 |

| Date | Rate | Total | Population |
| 1999 | 25.15 | 4,797 | 18,882,725 |
| 2000 | 22.04 | 4,244 | 18,976,457 |
| 2001 | 25.65 | 4,982 | 19,082,838 |
| 2002 | 23.85 | 4,663 | 19,137,800 |
| 2003 | 23.87 | 4,708 | 19,175,939 |
| 2004 | 22.85 | 4,530 | 19,171,567 |
| 2005 | 23.27 | 4,645 | 19,132,610 |
| 2006 | 26.20 | 5,235 | 19,104,631 |
| 2007 | 25.65 | 5,160 | 19,132,335 |
| 2008 | 24.79 | 5,042 | 19,212,436 |
| 2009 | 23.88 | 4,891 | 19,307,066 |
| 2010 | 24.19 | 5,004 | 19,378,102 |
| 2011 | 26.40 | 5,537 | 19,465,197 |
| 2012 | 27.40 | 5,786 | 19,570,261 |
| 2013 | 27.75 | 5,927 | 19,651,127 |
| 2014 | 27.63 | 5,945 | 19,746,227 |
| 2015 | 30.16 | 6,515 | 19,795,791 |
| 2016 | 34.23 | 7,354 | 19,745,289 |
| 2017 | 35.48 | 7,687 | 19,849,399 |
| 2018 | 34.22 | 7,415 | 19,542,209 |
| 2019 | 34.25 | 7,390 | 19,453,561 |
| 2020 | 41.69 | 8,756 | 19,336,776 |
| 2021 | 46.95 | 10,140 | 19,835,913 |

| Date | Rate | Total | Population |
| 1999 | 19.81 | 3,799 | 18,882,725 |
| 2000 | 19.98 | 3,877 | 18,976,457 |
| 2001 | 19.51 | 3,844 | 19,082,838 |
| 2002 | 19.74 | 3,934 | 19,137,800 |
| 2003 | 20.96 | 4,227 | 19,175,939 |
| 2004 | 19.23 | 3,913 | 19,171,567 |
| 2005 | 19.66 | 4,051 | 19,132,610 |
| 2006 | 18.58 | 3,848 | 19,104,631 |
| 2007 | 17.73 | 3,715 | 19,132,335 |
| 2008 | 16.91 | 3,605 | 19,212,436 |
| 2009 | 17.32 | 3,723 | 19,307,066 |
| 2010 | 16.65 | 3,642 | 19,378,102 |
| 2011 | 17.98 | 3,988 | 19,465,197 |
| 2012 | 17.68 | 4,010 | 19,570,261 |
| 2013 | 17.77 | 4,094 | 19,651,127 |
| 2014 | 17.38 | 4,064 | 19,746,227 |
| 2015 | 17.08 | 4,045 | 19,795,791 |
| 2016 | 16.90 | 4,038 | 19,745,289 |
| 2017 | 16.81 | 4,176 | 19,849,399 |
| 2018 | 18.16 | 4,519 | 19,542,209 |
| 2019 | 17.99 | 4,564 | 19,453,561 |
| 2020 | 21.20 | 5,410 | 19,336,776 |
| 2021 | 18.78 | 4,841 | 19,835,913 |

| Date | Rate | Total | Population |
| 1999 | 7.01 | 1,357 | 18,882,725 |
| 2000 | 7.80 | 1,539 | 18,976,457 |
| 2001 | 8.48 | 1,705 | 19,082,838 |
| 2002 | 8.85 | 1,803 | 19,137,800 |
| 2003 | 9.02 | 1,866 | 19,175,939 |
| 2004 | 9.53 | 1,989 | 19,171,567 |
| 2005 | 9.69 | 2,065 | 19,132,610 |
| 2006 | 9.36 | 2,021 | 19,104,631 |
| 2007 | 9.07 | 1,999 | 19,132,335 |
| 2008 | 10.31 | 2,303 | 19,212,436 |
| 2009 | 10.51 | 2,396 | 19,307,066 |
| 2010 | 11.32 | 2,616 | 19,378,102 |
| 2011 | 10.82 | 2,563 | 19,465,197 |
| 2012 | 10.93 | 2,640 | 19,570,261 |
| 2013 | 10.42 | 2,556 | 19,651,127 |
| 2014 | 10.67 | 2,639 | 19,746,227 |
| 2015 | 12.62 | 3,174 | 19,795,791 |
| 2016 | 13.08 | 3,349 | 19,745,289 |
| 2017 | 13.21 | 3,521 | 19,849,399 |
| 2018 | 13.90 | 3,755 | 19,542,209 |
| 2019 | 13.74 | 3,753 | 19,453,561 |
| 2020 | 14.04 | 3,862 | 19,336,776 |
| 2021 | 13.57 | 3,582 | 19,835,913 |

| Date | Rate | Total | Population |
| 1999 | 28.38 | 5,482 | 18,882,725 |
| 2000 | 26.50 | 5,201 | 18,976,457 |
| 2001 | 25.47 | 5,085 | 19,082,838 |
| 2002 | 26.56 | 5,368 | 19,137,800 |
| 2003 | 26.09 | 5,335 | 19,175,939 |
| 2004 | 26.63 | 5,499 | 19,171,567 |
| 2005 | 26.30 | 5,521 | 19,132,610 |
| 2006 | 23.02 | 4,892 | 19,104,631 |
| 2007 | 20.49 | 4,431 | 19,132,335 |
| 2008 | 21.04 | 4,609 | 19,212,436 |
| 2009 | 20.54 | 4,527 | 19,307,066 |
| 2010 | 20.64 | 4,642 | 19,378,102 |
| 2011 | 21.36 | 4,915 | 19,465,197 |
| 2012 | 18.81 | 4,404 | 19,570,261 |
| 2013 | 20.50 | 4,892 | 19,651,127 |
| 2014 | 19.53 | 4,702 | 19,746,227 |
| 2015 | 19.98 | 4,881 | 19,795,791 |
| 2016 | 18.32 | 4,513 | 19,745,289 |
| 2017 | 17.66 | 4,517 | 19,849,399 |
| 2018 | 18.45 | 4,749 | 19,542,209 |
| 2019 | 16.52 | 4,286 | 19,453,561 |
| 2020 | 18.21 | 4,756 | 19,336,776 |
| 2021 | 14.45 | 3,757 | 19,835,913 |

| Date | Rate | Total | Population |
| 1999 | 11.97 | 2,302 | 18,882,725 |
| 2000 | 12.52 | 2,440 | 18,976,457 |
| 2001 | 12.23 | 2,421 | 19,082,838 |
| 2002 | 12.28 | 2,465 | 19,137,800 |
| 2003 | 11.93 | 2,415 | 19,175,939 |
| 2004 | 11.63 | 2,383 | 19,171,567 |
| 2005 | 11.38 | 2,360 | 19,132,610 |
| 2006 | 11.20 | 2,351 | 19,104,631 |
| 2007 | 11.21 | 2,387 | 19,132,335 |
| 2008 | 11.06 | 2,394 | 19,212,436 |
| 2009 | 11.10 | 2,426 | 19,307,066 |
| 2010 | 11.00 | 2,439 | 19,378,102 |
| 2011 | 9.72 | 2,197 | 19,465,197 |
| 2012 | 9.76 | 2,240 | 19,570,261 |
| 2013 | 9.69 | 2,285 | 19,651,127 |
| 2014 | 9.29 | 2,207 | 19,746,227 |
| 2015 | 9.28 | 2,245 | 19,795,791 |
| 2016 | 9.82 | 2,385 | 19,745,289 |
| 2017 | 9.06 | 2,296 | 19,849,399 |
| 2018 | 9.43 | 2,411 | 19,542,209 |
| 2019 | 9.87 | 2,565 | 19,453,561 |
| 2020 | 10.14 | 2,651 | 19,336,776 |
| 2021 | 9.83 | 2,545 | 19,835,913 |

| Date | Rate | Total | Population |
| 1999 | 11.60 | 2,228 | 18,882,725 |
| 2000 | 11.84 | 2,305 | 18,976,457 |
| 2001 | 11.68 | 2,308 | 19,082,838 |
| 2002 | 11.62 | 2,319 | 19,137,800 |
| 2003 | 10.45 | 2,114 | 19,175,939 |
| 2004 | 11.16 | 2,278 | 19,171,567 |
| 2005 | 11.02 | 2,277 | 19,132,610 |
| 2006 | 11.09 | 2,309 | 19,104,631 |
| 2007 | 11.11 | 2,343 | 19,132,335 |
| 2008 | 11.06 | 2,365 | 19,212,436 |
| 2009 | 10.80 | 2,343 | 19,307,066 |
| 2010 | 10.09 | 2,210 | 19,378,102 |
| 2011 | 9.89 | 2,210 | 19,465,197 |
| 2012 | 10.31 | 2,355 | 19,570,261 |
| 2013 | 10.28 | 2,387 | 19,651,127 |
| 2014 | 10.83 | 2,568 | 19,746,227 |
| 2015 | 10.90 | 2,601 | 19,795,791 |
| 2016 | 10.51 | 2,545 | 19,745,289 |
| 2017 | 8.89 | 2,239 | 19,849,399 |
| 2018 | 7.25 | 1,825 | 19,542,209 |
| 2019 | 6.87 | 1,756 | 19,453,561 |
| 2020 | 7.47 | 1,896 | 19,336,776 |
| 2021 | 8.64 | 2,232 | 19,835,913 |

| Date | Rate | Total | Population |
| 1999 | 6.27 | 1,196 | 18,882,725 |
| 2000 | 5.91 | 1,132 | 18,976,457 |
| 2001 | 6.48 | 1,253 | 19,082,838 |
| 2002 | 6.31 | 1,228 | 19,137,800 |
| 2003 | 5.94 | 1,169 | 19,175,939 |
| 2004 | 6.04 | 1,187 | 19,171,567 |
| 2005 | 6.04 | 1,189 | 19,132,610 |
| 2006 | 6.69 | 1,326 | 19,104,631 |
| 2007 | 7.06 | 1,396 | 19,132,335 |
| 2008 | 7.06 | 1,409 | 19,212,436 |
| 2009 | 7.01 | 1,417 | 19,307,066 |
| 2010 | 7.66 | 1,547 | 19,378,102 |
| 2011 | 8.15 | 1,658 | 19,465,197 |
| 2012 | 8.26 | 1,708 | 19,570,261 |
| 2013 | 8.12 | 1,687 | 19,651,127 |
| 2014 | 8.12 | 1,700 | 19,746,227 |
| 2015 | 7.85 | 1,652 | 19,795,791 |
| 2016 | 8.09 | 1,679 | 19,745,289 |
| 2017 | 8.12 | 1,696 | 19,849,399 |
| 2018 | 8.28 | 1,723 | 19,542,209 |
| 2019 | 8.30 | 1,705 | 19,453,561 |
| 2020 | 8.03 | 1,642 | 19,336,776 |
| 2021 | 7.94 | 1,660 | 19,835,913 |

| Date | Rate | Total | Population |
| 1999 | 6.57 | 1,264 | 18,882,725 |
| 2000 | 6.87 | 1,341 | 18,976,457 |
| 2001 | 7.63 | 1,517 | 19,082,838 |
| 2002 | 7.03 | 1,416 | 19,137,800 |
| 2003 | 7.22 | 1,472 | 19,175,939 |
| 2004 | 7.85 | 1,616 | 19,171,567 |
| 2005 | 8.13 | 1,693 | 19,132,610 |
| 2006 | 7.57 | 1,613 | 19,104,631 |
| 2007 | 7.65 | 1,645 | 19,132,335 |
| 2008 | 8.46 | 1,850 | 19,212,436 |
| 2009 | 8.65 | 1,912 | 19,307,066 |
| 2010 | 9.11 | 2,048 | 19,378,102 |
| 2011 | 8.97 | 2,069 | 19,465,197 |
| 2012 | 8.55 | 2,001 | 19,570,261 |
| 2013 | 9.51 | 2,269 | 19,651,127 |
| 2014 | 8.76 | 2,117 | 19,746,227 |
| 2015 | 9.34 | 2,287 | 19,795,791 |
| 2016 | 9.91 | 2,468 | 19,745,289 |
| 2017 | 10.41 | 2,699 | 19,849,399 |
| 2018 | 10.46 | 2,731 | 19,542,209 |
| 2019 | 10.57 | 2,788 | 19,453,561 |
| 2020 | 11.78 | 3,136 | 19,336,776 |
| 2021 | 11.03 | 2,900 | 19,835,913 |

| Date | Rate | Total | Population |
| 1999 | 8.08 | 1,534 | 18,882,725 |
| 2000 | 7.31 | 1,409 | 18,976,457 |
| 2001 | 7.61 | 1,488 | 19,082,838 |
| 2002 | 6.76 | 1,338 | 19,137,800 |
| 2003 | 6.84 | 1,374 | 19,175,939 |
| 2004 | 6.39 | 1,296 | 19,171,567 |
| 2005 | 5.98 | 1,224 | 19,132,610 |
| 2006 | 5.92 | 1,223 | 19,104,631 |
| 2007 | 6.28 | 1,308 | 19,132,335 |
| 2008 | 6.45 | 1,369 | 19,212,436 |
| 2009 | 6.05 | 1,296 | 19,307,066 |
| 2010 | 6.59 | 1,434 | 19,378,102 |
| 2011 | 6.80 | 1,498 | 19,465,197 |
| 2012 | 6.71 | 1,507 | 19,570,261 |
| 2013 | 6.86 | 1,559 | 19,651,127 |
| 2014 | 6.80 | 1,575 | 19,746,227 |
| 2015 | 6.74 | 1,571 | 19,795,791 |
| 2016 | 6.92 | 1,614 | 19,745,289 |
| 2017 | 7.07 | 1,671 | 19,849,399 |
| 2018 | 6.93 | 1,650 | 19,542,209 |
| 2019 | 6.95 | 1,670 | 19,453,561 |
| 2020 | 8.04 | 1,860 | 19,336,776 |
| 2021 | 8.22 | 1,966 | 19,835,913 |

| Date | Rate | Total | Population |
| 1999 | 3.05 | 589 | 18,882,725 |
| 2000 | 3.45 | 673 | 18,976,457 |
| 2001 | 3.29 | 653 | 19,082,838 |
| 2002 | 3.32 | 670 | 19,137,800 |
| 2003 | 3.61 | 734 | 19,175,939 |
| 2004 | 3.59 | 735 | 19,171,567 |
| 2005 | 3.88 | 805 | 19,132,610 |
| 2006 | 4.04 | 848 | 19,104,631 |
| 2007 | 4.14 | 878 | 19,132,335 |
| 2008 | 4.35 | 929 | 19,212,436 |
| 2009 | 4.46 | 964 | 19,307,066 |
| 2010 | 4.48 | 972 | 19,378,102 |
| 2011 | 4.63 | 1,033 | 19,465,197 |
| 2012 | 4.82 | 1,092 | 19,570,261 |
| 2013 | 5.24 | 1,208 | 19,651,127 |
| 2014 | 5.26 | 1,239 | 19,746,227 |
| 2015 | 5.26 | 1,247 | 19,795,791 |
| 2016 | 5.70 | 1,368 | 19,745,289 |
| 2017 | 5.78 | 1,449 | 19,849,399 |
| 2018 | 6.31 | 1,601 | 19,542,209 |
| 2019 | 6.19 | 1,592 | 19,453,561 |
| 2020 | 7.23 | 1,899 | 19,336,776 |
| 2021 | 6.69 | 1,717 | 19,835,913 |

| Date | Rate | Total | Population |
| 1999 | 5.09 | 969 | 18,882,725 |
| 2000 | 5.20 | 991 | 18,976,457 |
| 2001 | 14.58 | 2,818 | 19,082,838 |
| 2002 | 4.83 | 929 | 19,137,800 |
| 2003 | 5.01 | 963 | 19,175,939 |
| 2004 | 4.47 | 860 | 19,171,567 |
| 2005 | 4.70 | 901 | 19,132,610 |
| 2006 | 5.01 | 962 | 19,104,631 |
| 2007 | 4.40 | 840 | 19,132,335 |
| 2008 | 4.59 | 882 | 19,212,436 |
| 2009 | 4.35 | 840 | 19,307,066 |
| 2010 | 4.61 | 898 | 19,378,102 |
| 2011 | 4.25 | 830 | 19,465,197 |
| 2012 | 3.74 | 730 | 19,570,261 |
| 2013 | 3.48 | 686 | 19,651,127 |
| 2014 | 3.38 | 662 | 19,746,227 |
| 2015 | 3.41 | 671 | 19,795,791 |
| 2016 | 3.60 | 696 | 19,745,289 |
| 2017 | 2.96 | 577 | 19,849,399 |
| 2018 | 3.19 | 611 | 19,542,209 |
| 2019 | 3.17 | 601 | 19,453,561 |
| 2020 | 4.66 | 875 | 19,336,776 |
| 2021 | 4.84 | 918 | 19,835,913 |
CHOOSE NEW STATE
COVID-19 UPDATE
4/1/24
| CASES | DEATHS |
|
7,581,876
|
83,374
|
COVID-19 DEATH SIMULATOR
Current Covid-19 deaths compared to a simulated calendar based historical average of selected New York causes.

WITH STATE ADJUSTMENTS

WITH STATE ADJUSTMENTS

WITH STATE ADJUSTMENTS
Centers for Disease Control and Prevention: Final Deaths 2021 Release Date 12/22.


