


HEALTH PROFILE: Canada
Data Sources: WHO, CDC, World Bank, UN.
CHOOSE COUNTRY

COUNTRY PROFILE
Afghanistan
Albania
Algeria
Angola
Antigua/Bar.
Arab Emirates
Argentina
Armenia
Australia
Austria
Azerbaijan
Bahamas
Bahrain
Bangladesh
Barbados
Belarus
Belgium
Belize
Benin
Bhutan
Bolivia
Bosnia/Herzeg.
Botswana
Brazil
Brunei
Bulgaria
Burkina Faso
Burundi
Cambodia
Cameroon
Canada
Cape Verde
Central Africa
Chad
Chile
China
Colombia
Comoros
Congo
Costa Rica
Cote d Ivoire
Croatia
Cuba
Cyprus
Czech Republic
Denmark
Djibouti
Dominican Rep.
DR Congo
Ecuador
Egypt
El Salvador
Equ. Guinea
Eritrea
Estonia
Ethiopia
Fiji
Finland
France
Gabon
Gambia
Georgia
Germany
Ghana
Greece
Grenada
Guatemala
Guinea
Guinea-Bissau
Guyana
Haiti
Honduras
Hungary
Iceland
India
Indonesia
Iran
Iraq
Ireland
Israel
Italy
Jamaica
Japan
Jordan
Kazakhstan
Kenya
Kiribati
Kuwait
Kyrgyzstan
Laos
Latvia
Lebanon
Lesotho
Liberia
Libya
Lithuania
Luxembourg
Madagascar
Malawi
Malaysia
Maldives
Mali
Malta
Mauritania
Mauritius
Mexico
Micronesia
Moldova
Mongolia
Montenegro
Morocco
Mozambique
Myanmar
Namibia
Nepal
Netherlands
New Guinea
New Zealand
Nicaragua
Niger
Nigeria
No Macedonia
North Korea
Norway
Oman
Pakistan
Panama
Paraguay
Peru
Philippines
Poland
Portugal
Qatar
Romania
Russia
Rwanda
Saint Lucia
Saint Vincent
Samoa
Sao Tome
Saudi Arabia
Senegal
Serbia
Seychelles
Sierra Leone
Singapore
Slovakia
Slovenia
Solomon Isl.
Somalia
South Africa
South Korea
South Sudan
Spain
Sri Lanka
Sudan
Suriname
Swaziland
Sweden
Switzerland
Syria
Tajikistan
Tanzania
Thailand
Timor-Leste
Togo
Tonga
Trinidad/Tob.
Tunisia
Turkey
Turkmenistan
Uganda
Ukraine
United Kingdom
United States
Uruguay
Uzbekistan
Vanuatu
Venezuela
Viet Nam
Yemen
Zambia
Zimbabwe
CANADA POPULATION PYRAMID
Play
Pause


COUNTRY PROFILE
Afghanistan
Albania
Algeria
Angola
Antigua/Bar.
Arab Emirates
Argentina
Armenia
Australia
Austria
Azerbaijan
Bahamas
Bahrain
Bangladesh
Barbados
Belarus
Belgium
Belize
Benin
Bhutan
Bolivia
Bosnia/Herzeg.
Botswana
Brazil
Brunei
Bulgaria
Burkina Faso
Burundi
Cambodia
Cameroon
Canada
Cape Verde
Central Africa
Chad
Chile
China
Colombia
Comoros
Congo
Costa Rica
Cote d Ivoire
Croatia
Cuba
Cyprus
Czech Republic
Denmark
Djibouti
Dominican Rep.
DR Congo
Ecuador
Egypt
El Salvador
Equ. Guinea
Eritrea
Estonia
Ethiopia
Fiji
Finland
France
Gabon
Gambia
Georgia
Germany
Ghana
Greece
Grenada
Guatemala
Guinea
Guinea-Bissau
Guyana
Haiti
Honduras
Hungary
Iceland
India
Indonesia
Iran
Iraq
Ireland
Israel
Italy
Jamaica
Japan
Jordan
Kazakhstan
Kenya
Kiribati
Kuwait
Kyrgyzstan
Laos
Latvia
Lebanon
Lesotho
Liberia
Libya
Lithuania
Luxembourg
Madagascar
Malawi
Malaysia
Maldives
Mali
Malta
Mauritania
Mauritius
Mexico
Micronesia
Moldova
Mongolia
Montenegro
Morocco
Mozambique
Myanmar
Namibia
Nepal
Netherlands
New Guinea
New Zealand
Nicaragua
Niger
Nigeria
No Macedonia
North Korea
Norway
Oman
Pakistan
Panama
Paraguay
Peru
Philippines
Poland
Portugal
Qatar
Romania
Russia
Rwanda
Saint Lucia
Saint Vincent
Samoa
Sao Tome
Saudi Arabia
Senegal
Serbia
Seychelles
Sierra Leone
Singapore
Slovakia
Slovenia
Solomon Isl.
Somalia
South Africa
South Korea
South Sudan
Spain
Sri Lanka
Sudan
Suriname
Swaziland
Sweden
Switzerland
Syria
Tajikistan
Tanzania
Thailand
Timor-Leste
Togo
Tonga
Trinidad/Tob.
Tunisia
Turkey
Turkmenistan
Uganda
Ukraine
United Kingdom
United States
Uruguay
Uzbekistan
Vanuatu
Venezuela
Viet Nam
Yemen
Zambia
Zimbabwe
CANADA LIFE EXPECTANCY BY AGE GOOD
POOR
| World Rank | ||||
| Male | Female | M | F | |
| At Birth |
80.4
|
84.1
|
14
|
16
|
| Age 5 |
80.8
|
84.4
|
13
|
14
|
| Age 10 |
80.8
|
84.4
|
13
|
14
|
| Age 15 |
80.9
|
84.5
|
13
|
14
|
| Age 20 |
81.0
|
84.6
|
12
|
14
|
| Age 25 |
81.2
|
84.7
|
11
|
14
|
| Age 30 |
81.5
|
84.8
|
11
|
14
|
| Age 35 |
81.7
|
84.9
|
10
|
13
|
| Age 40 |
82.0
|
85.0
|
7
|
12
|
| Age 45 |
82.3
|
85.2
|
6
|
12
|
| Age 50 |
82.7
|
85.5
|
6
|
13
|
| Age 55 |
83.1
|
85.9
|
5
|
13
|
| Age 60 |
83.8
|
86.4
|
4
|
12
|
| Age 65 |
84.8
|
87.1
|
3
|
10
|
| Age 70 |
85.9
|
87.9
|
3
|
9
|
| Age 75 |
87.4
|
89.0
|
2
|
8
|
| Age 80 |
89.2
|
90.4
|
2
|
9
|
| Age 85 |
91.6
|
92.2
|
5
|
9
|
CANADA TOP 50 CAUSES OF DEATH
AGE-STANDARDIZED DEATH RATE
PER 100,000 POPULATION
GOOD
POOR
| TOP 50 CAUSES OF DEATH | Rate | World Rank | |
| 1. | Coronary Heart Disease |
45.15
|
166
|
| 2. | Alzheimers & Dementia |
27.87
|
13
|
| 3. | Lung Cancers |
27.23
|
22
|
| 4. | Lung Disease |
15.91
|
133
|
| 5. | Breast Cancer |
15.43
|
111
|
| 6. | Stroke |
15.12
|
182
|
| 7. | Colon-Rectum Cancers |
12.23
|
46
|
| 8. | Prostate Cancer |
11.92
|
124
|
| 9. | Suicide |
10.34
|
67
|
| 10. | Drug Use |
8.70
|
2
|
| 11. | Influenza and Pneumonia |
7.69
|
169
|
| 12. | Diabetes Mellitus |
7.22
|
156
|
| 13. | Pancreas Cancer |
6.57
|
47
|
| 14. | Lymphomas |
6.52
|
26
|
| 15. | Liver Disease |
5.73
|
159
|
| 16. | Ovary Cancer |
5.08
|
63
|
| 17. | Falls |
5.07
|
101
|
| 18. | Kidney Disease |
4.99
|
168
|
| 19. | Road Traffic Accidents |
4.58
|
157
|
| 20. | Endocrine Disorders |
4.41
|
77
|
| 21. | Liver Cancer |
4.21
|
120
|
| 22. | Leukemia |
4.06
|
67
|
| 23. | Parkinson's Disease |
3.46
|
128
|
| 24. | Other Injuries |
3.35
|
164
|
| 25. | Oesophagus Cancer |
3.01
|
73
|
| TOP 50 CAUSES OF DEATH | Rate | World Rank | |
| 26. | Congenital Anomalies |
2.99
|
156
|
| 27. | Inflammatory/Heart |
2.94
|
141
|
| 28. | Uterin Cancer |
2.91
|
63
|
| 29. | Bladder Cancer |
2.89
|
59
|
| 30. | Stomach Cancer |
2.86
|
161
|
| 31. | Hypertension |
2.79
|
169
|
| 32. | Alcohol |
2.76
|
44
|
| 33. | Skin Cancers |
2.27
|
65
|
| 34. | Oral Cancer |
2.18
|
126
|
| 35. | Other Neoplasms |
1.99
|
51
|
| 36. | Cervical Cancer |
1.94
|
169
|
| 37. | Low Birth Weight |
1.90
|
148
|
| 38. | Violence |
1.60
|
139
|
| 39. | Multiple Sclerosis |
1.09
|
6
|
| 40. | Diarrhoeal diseases |
0.90
|
140
|
| 41. | Epilepsy |
0.81
|
153
|
| 42. | Skin Disease |
0.76
|
122
|
| 43. | Rheumatic Heart Disease |
0.73
|
135
|
| 44. | Drownings |
0.71
|
160
|
| 45. | Birth Trauma |
0.65
|
140
|
| 46. | Hepatitis C |
0.60
|
15
|
| 47. | Peptic Ulcer Disease |
0.54
|
172
|
| 48. | Fires |
0.41
|
153
|
| 49. | Rheumatoid Arthritis |
0.38
|
80
|
| 50. | Asthma |
0.37
|
173
|
CANADA TOTAL DEATHS BY CAUSE PERCENT TOP 50 CAUSES
| Deaths | % | ||
| 1. | Coronary Heart Disease |
40,063
|
17.18
|
| 2. | Alzheimers & Dementia |
30,970
|
13.28
|
| 3. | Lung Cancers |
20,937
|
8.98
|
| 4. | Lung Disease |
14,212
|
6.09
|
| 5. | Stroke |
14,159
|
6.07
|
| 6. | Colon-Rectum Cancers |
9,651
|
4.14
|
| 7. | Influenza and Pneumonia |
7,431
|
3.19
|
| 8. | Breast Cancer |
5,910
|
2.53
|
| 9. | Diabetes Mellitus |
5,718
|
2.45
|
| 10. | Lymphomas |
5,146
|
2.21
|
| 11. | Pancreas Cancer |
5,057
|
2.17
|
| 12. | Falls |
4,829
|
2.07
|
| 13. | Prostate Cancer |
4,711
|
2.02
|
| 14. | Kidney Disease |
4,578
|
1.96
|
| 15. | Suicide |
4,417
|
1.89
|
| 16. | Drug Use |
3,686
|
1.58
|
| 17. | Liver Disease |
3,624
|
1.55
|
| 18. | Parkinson's Disease |
3,359
|
1.44
|
| 19. | Endocrine Disorders |
3,233
|
1.39
|
| 20. | Liver Cancer |
3,113
|
1.33
|
| 21. | Leukemia |
3,098
|
1.33
|
| 22. | Hypertension |
2,563
|
1.10
|
| 23. | Bladder Cancer |
2,521
|
1.08
|
| 24. | Other Injuries |
2,392
|
1.03
|
| 25. | Oesophagus Cancer |
2,230
|
0.96
|
| Deaths | % | ||
| 26. | Stomach Cancer |
2,177
|
0.93
|
| 27. | Inflammatory/Heart |
2,060
|
0.88
|
| 28. | Road Traffic Accidents |
1,998
|
0.86
|
| 29. | Ovary Cancer |
1,902
|
0.82
|
| 30. | Skin Cancers |
1,756
|
0.75
|
| 31. | Other Neoplasms |
1,679
|
0.72
|
| 32. | Oral Cancer |
1,592
|
0.68
|
| 33. | Alcohol |
1,491
|
0.64
|
| 34. | Uterin Cancer |
1,183
|
0.51
|
| 35. | Congenital Anomalies |
1,081
|
0.46
|
| 36. | Diarrhoeal diseases |
840
|
0.36
|
| 37. | Multiple Sclerosis |
692
|
0.30
|
| 38. | Skin Disease |
679
|
0.29
|
| 39. | Rheumatic Heart Disease |
636
|
0.27
|
| 40. | Violence |
605
|
0.26
|
| 41. | Cervical Cancer |
578
|
0.25
|
| 42. | Low Birth Weight |
553
|
0.24
|
| 43. | Peptic Ulcer Disease |
442
|
0.19
|
| 44. | Epilepsy |
384
|
0.16
|
| 45. | Hepatitis C |
363
|
0.16
|
| 46. | Anemia |
343
|
0.15
|
| 47. | Rheumatoid Arthritis |
322
|
0.14
|
| 48. | Drownings |
283
|
0.12
|
| 49. | Asthma |
262
|
0.11
|
| 50. | Birth Trauma |
193
|
0.08
|
CANADA CANCER RANK BY TYPE AGE-STANDARDIZED DEATH RATE
PER 100,000 POPULATION
GOOD
POOR
| Rate | World Rank | ||
| 1. | Lung Cancers |
27.23
|
22
|
| 2. | Breast Cancer |
15.43
|
111
|
| 3. | Colon-Rectum Cancers |
12.23
|
46
|
| 4. | Prostate Cancer |
11.92
|
124
|
| 5. | Pancreas Cancer |
6.57
|
47
|
| 6. | Lymphomas |
6.52
|
26
|
| 7. | Ovary Cancer |
5.08
|
63
|
| 8. | Liver Cancer |
4.21
|
120
|
| Rate | World Rank | ||
| 9. | Leukemia |
4.06
|
67
|
| 10. | Oesophagus Cancer |
3.01
|
73
|
| 11. | Uterin Cancer |
2.91
|
63
|
| 12. | Bladder Cancer |
2.89
|
59
|
| 13. | Stomach Cancer |
2.86
|
161
|
| 14. | Skin Cancers |
2.27
|
65
|
| 15. | Oral Cancer |
2.18
|
126
|
| 16. | Cervical Cancer |
1.94
|
169
|
CANADA HEALTH RISK FACTORS
GOOD
POOR
| ALCOHOL LITERS | |
| Total | Rank |
|
8.8
|
55
|
| SMOKING % | |||
| M | F | Rank | |
|
14.8
|
10.2
|
138
|
64
|
| OBESITY % | |||
| M | F | Rank | |
|
29.5
|
29.3
|
17
|
48
|
| HAPPINESS SCORE | |
| Total | Rank |
|
7.03
|
15
|
CANADA LIFE EXPECTANCY HISTORY GOOD
POOR
| World Rank | ||||||
| Male | Female | All | M | F | All | |
| 1960 |
68.3
|
74.2
|
71.1
|
8
|
5
|
8
|
| 1970 |
69.3
|
76.3
|
72.7
|
10
|
4
|
6
|
| 1980 |
71.6
|
78.7
|
75.1
|
12
|
6
|
7
|
| 1990 |
74.3
|
80.7
|
77.4
|
6
|
4
|
3
|
| 2000 |
76.4
|
81.7
|
79.1
|
7
|
8
|
7
|
| 2010 |
79.0
|
83.4
|
81.2
|
10
|
12
|
11
|
| 2019 |
80.4
|
84.1
|
82.2
|
14
|
16
|
15
|
CANADA DEMOGRAPHIC SUMMARY | Value | World Rank | |
| Population Total |
37.943m
|
38
|
| Sex Ratio M / F |
0.98
|
100
|
| Population 0-14 |
16.0%
|
164
|
| Population 15-64 |
65.0%
|
96
|
| Population 65 + |
19.0%
|
25
|
| Birth Rate / 1000 |
10.17
|
158
|
| Death Rate / 1000 |
8.12
|
68
|
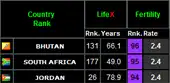
| Fertility Rate |
1.57
|
164
|
| Infant Mortality |
4.44
|
158
|
| Sex Ratio At Birth M / F |
1.05
|
105
|
| Sex Ratio Under 15 M / F |
1.06
|
56
|
| Value | World Rank | |
| Sex Ratio 15-64 M / F |
1.01
|
68
|
| Sex Ratio 65 + M / F |
0.84
|
65
|
| Net Migration |
5.55
|
12
|
| Population Growth |
0.77%
|
114
|
| Literacy Total |
99.0%
|
46
|
| Literacy Male |
N/D
|
N/D
|
| Literacy Female |
N/D
|
N/D
|
| Unemployment |
5.7%
|
108
|
| Life Expectancy / Birth |
82.2
|
15
|
| Healthy Life Expectancy |
71.3
|
16
|
| GDP per Capita USD |
$45,900
|
23
|
COVID-19 REPORT
| CASES | DEATHS |
|
4,944,196
|
58,972
|
4/1/24
COVID-19 DEATH SIMULATOR A calendar based simulation of Covid-19 deaths compared to historical average of selected Canada causes.
COVID-19 CASE CHART CUMULATIVE WITH COUNTRY ADJUSTMENTS
COVID-19 DEATH CHART CUMULATIVE WITH COUNTRY ADJUSTMENTS
Data rounded. Decimals affect ranking.
Data Source: WORLD HEALTH ORGANIZATION 2020
Data Accuracy Not Guaranteed
WHO Excludes Cause of Death Data For the following countries: Andorra, Cook Islands, Dominica, Marshall Islands, Monaco, Nauru, Niue, Palau, Saint Kitts, San Marino, Tuvalu.
WHO Excludes Cause of Death Data For the following countries: Andorra, Cook Islands, Dominica, Marshall Islands, Monaco, Nauru, Niue, Palau, Saint Kitts, San Marino, Tuvalu.