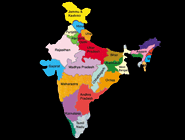
Click Country Link To Compare

|
FRANCE
|
INDIA
|
Deaths |
| Cause Of Death |
Rnk |
Deaths |
Rnk |
Deaths |
Summary |
| Coronary Heart Disease |
1 |
1,302,099 |
1 |
1,520,034 | -
217,935 |
| Alzheimers & Dementia |
2 |
1,095,519 |
17 |
126,593 | +
968,926 |
| Stroke |
3 |
749,226 |
3 |
697,038 | +
52,188 |
| Lung Cancers |
4 |
734,859 |
21 |
88,276 | +
646,583 |
| Colon-Rectum Cancers |
5 |
450,381 |
25 |
77,368 | +
373,013 |
| Influenza and Pneumonia |
6 |
407,452 |
6 |
392,425 | +
15,028 |
| Lung Disease |
7 |
375,733 |
2 |
879,732 | -
503,999 |
| Breast Cancer |
8 |
320,174 |
22 |
82,821 | +
237,353 |
| Other Injuries |
9 |
311,592 |
15 |
149,570 | +
162,022 |
| Pancreas Cancer |
10 |
254,720 |
37 |
32,812 | +
221,908 |
| Kidney Disease |
11 |
236,521 |
11 |
222,903 | +
13,619 |
| Diabetes Mellitus |
12 |
224,876 |
7 |
271,495 | -
46,619 |
| Prostate Cancer |
13 |
224,074 |
38 |
30,945 | +
193,129 |
| Lymphomas |
14 |
207,474 |
33 |
40,159 | +
167,315 |
| Liver Cancer |
15 |
197,289 |
39 |
30,369 | +
166,921 |
| Suicide |
16 |
184,675 |
14 |
173,347 | +
11,328 |
| Other Neoplasms |
17 |
180,753 |
62 |
2,968 | +
177,785 |
| Falls |
18 |
170,725 |
10 |
225,755 | -
55,030 |
| Endocrine Disorders |
19 |
166,647 |
47 |
15,264 | +
151,382 |
| Parkinson's Disease |
20 |
156,008 |
32 |
43,398 | +
112,610 |
| Leukemia |
21 |
153,674 |
35 |
33,383 | +
120,292 |
| Liver Disease |
22 |
152,135 |
8 |
268,580 | -
116,445 |
| Hypertension |
23 |
146,516 |
19 |
108,050 | +
38,466 |
| Bladder Cancer |
24 |
135,311 |
48 |
14,081 | +
121,230 |
| Inflammatory/Heart |
25 |
125,002 |
49 |
12,651 | +
112,352 |
| Stomach Cancer |
26 |
113,977 |
24 |
81,058 | +
32,919 |
| Oral Cancer |
27 |
96,367 |
16 |
134,187 | -
37,820 |
| Oesophagus Cancer |
28 |
96,308 |
34 |
38,898 | +
57,410 |
| Malnutrition |
29 |
86,795 |
55 |
8,626 | +
78,168 |
| Ovary Cancer |
30 |
81,690 |
44 |
21,947 | +
59,743 |
| Road Traffic Accidents |
31 |
68,813 |
12 |
212,596 | -
143,783 |
| Skin Cancers |
32 |
67,097 |
60 |
5,054 | +
62,043 |
| Alcohol |
33 |
65,717 |
43 |
23,097 | +
42,620 |
| Uterin Cancer |
34 |
56,070 |
59 |
6,841 | +
49,230 |
| Congenital Anomalies |
35 |
41,468 |
23 |
82,769 | -
41,301 |
| Drug Use |
36 |
38,762 |
52 |
11,747 | +
27,015 |
| Epilepsy |
37 |
38,444 |
40 |
30,307 | +
8,136 |
| Diarrhoeal diseases |
38 |
37,247 |
4 |
670,315 | -
633,067 |
| Skin Disease |
39 |
32,929 |
45 |
17,857 | +
15,072 |
| Cervical Cancer |
40 |
32,429 |
30 |
45,319 | -
12,890 |
| Rheumatic Heart Disease |
41 |
28,528 |
18 |
126,079 | -
97,551 |
| Asthma |
42 |
21,413 |
13 |
196,051 | -
174,638 |
| Peptic Ulcer Disease |
43 |
20,320 |
26 |
68,108 | -
47,787 |
| Anemia |
44 |
20,050 |
81 |
0 | +
20,050 |
| Drownings |
45 |
17,886 |
28 |
48,774 | -
30,889 |
| Multiple Sclerosis |
46 |
15,500 |
63 |
2,328 | +
13,172 |
| Low Birth Weight |
47 |
13,414 |
9 |
238,739 | -
225,326 |
| Schizophrenia |
48 |
13,339 |
83 |
0 | +
13,339 |
| Violence |
49 |
11,079 |
27 |
51,767 | -
40,688 |
| Tuberculosis |
50 |
8,967 |
5 |
435,882 | -
426,915 |
| Rheumatoid Arthritis |
51 |
8,788 |
50 |
11,931 | -
3,143 |
| Hepatitis C |
52 |
8,575 |
65 |
1,364 | +
7,211 |
| Fires |
53 |
8,307 |
42 |
23,265 | -
14,958 |
| HIV/AIDS |
54 |
7,458 |
31 |
44,406 | -
36,947 |
| Birth Trauma |
55 |
6,363 |
20 |
102,819 | -
96,456 |
| Osteoarthritis |
56 |
5,057 |
85 |
0 | +
5,057 |
| Poisonings |
57 |
4,694 |
61 |
3,540 | +
1,154 |
| Meningitis |
58 |
3,368 |
36 |
33,337 | -
29,968 |
| Hepatitis B |
59 |
2,787 |
56 |
8,184 | -
5,397 |
| Oral conditions |
60 |
2,428 |
84 |
0 | +
2,428 |
| Appendicitis |
61 |
1,849 |
53 |
11,245 | -
9,397 |
| Prostatic Hypertrophy |
62 |
1,555 |
86 |
0 | +
1,555 |
| Upper Respiratory |
63 |
1,107 |
68 |
584 | +
523 |
| Maternal Conditions |
64 |
1,068 |
41 |
25,917 | -
24,849 |
| Otitis Media |
65 |
324 |
71 |
68 | +
256 |
| Encephalitis |
66 |
167 |
29 |
48,080 | -
47,914 |
| War |
67 |
141 |
67 |
890 | -
749 |
| Syphilis |
68 |
80 |
64 |
2,007 | -
1,927 |
| Pertussis |
69 |
57 |
54 |
10,094 | -
10,036 |
| Tetanus |
70 |
45 |
58 |
7,093 | -
7,047 |
| Schistosomiasis |
71 |
17 |
76 |
0 | +
17 |
| Leprosy |
72 |
15 |
73 |
0 | +
15 |
| Leishmaniasis |
73 |
14 |
66 |
973 | -
959 |
| Iodine Deficiency |
74 |
13 |
79 |
0 | +
13 |
| Diphtheria |
75 |
12 |
72 |
65 | -
53 |
| Dengue |
76 |
8 |
46 |
17,546 | -
17,537 |
| Measles |
77 |
7 |
51 |
11,923 | -
11,916 |
| Chlamydia |
78 |
0 |
69 |
379 | -
379 |
| Ascariasis |
79 |
0 |
70 |
126 | -
126 |
| Trichuriasis |
80 |
0 |
74 |
0 | -
0 |
| Hookworm Disease |
81 |
0 |
75 |
0 | -
0 |
| Malaria |
82 |
0 |
57 |
7,705 | -
7,705 |
| Trypanosomiasis |
83 |
0 |
78 |
0 | -
0 |
| Chagas disease |
84 |
0 |
77 |
0 | -
0 |
| Vitamin A Deficiency |
85 |
0 |
80 |
0 | -
0 |
| Depression |
86 |
0 |
82 |
0 | -
0 |
|
TOTAL DEATHS |
|
|
|
Note: Population is Equalized to INDIA
France

India

THE INTELLECTUAL EXERCISE
The point of this intellectual exercise is to measure what would happen if two countries shared the same leading
causes of death. To make these comparisons possible we equalized the population and used total deaths for each country's top 10 causes to simulate an "Exchange."
Use the chart on the left to sort by the country name and use the summary plus and minus column to measure the
differences in total deaths.
Life Expectancy statistics are calculated the same way everywhere in the world, but what we die from can be very
different depending upon where we live. Despite these differences, with rare exception, the top 10 causes of death
for any given country will represent between 70-80% of their total deaths. This is an intellectual exercise only,
not a comparison of which country is healthier or to challenge existing life expectancy rankings. If you prefer to
see total deaths for over 80 causes and choose your own countries to compare go here:
https://www.worldlifeexpectancy.com/world-rankings-total-deaths
ABOUT OUR DATA
All meaningful comparisons between countries should be made using the same data source and year. The most reliable
source for International comparisons is the World Health Organization because it is standardized for cross
cultural comparisons. It is also reviewed annually, which often makes it more current than individual country data
that can take years to compile. The WHO data includes individual country "projections," that are calculated based
upon an annual consultation with each country before it is published. There are differences however, such as WHO
data separates different forms of heart disease and cancer and combines Alzheimer's with Dementia. In this top 10
comparison WHO data for both countries was used.
Data rounded. Decimals affect ranking.
Data Source: WORLD HEALTH ORGANIZATION 2020


