


Click to Select
Click to Select
Click to Select
Click to Select
Click to Select
Click to Select
Click to Select
Click to Select
Click to Select
Click to Select
Click to Select
Click to Select
Click to Select
Click to Select
Click to Select
Click to Select
Click to Select
Click to Select
Click to Select
Click to Select
Click to Select
Click to Select
Click to Select
Click to Select
Click to Select
Click to Select
Click to Select
Click to Select
Click to Select
Click to Select
Click to Select
Click to Select
Click to Select
Click to Select
Click to Select
Click to Select
Click to Select
Click to Select
Click to Select
Click to Select
Click to Select
Click to Select
Click to Select
Click to Select
Click to Select
Click to Select
Click to Select
Click to Select
Click to Select
Click to Select
Click to Select
Click to Select
Click to Select
Click to Select
Click to Select
Click to Select
Click to Select
Click to Select
Click to Select
Click to Select

Click to Select
Click to Select
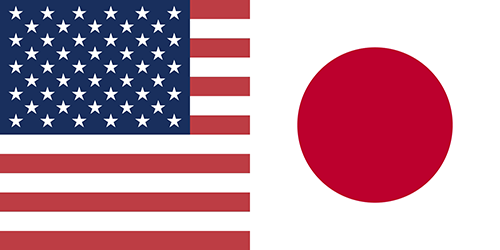
What happens when the USA goes head to head with Japan using only the top 10 causes of death? You will be surprised!
Compare the Top 10 causes of death and see which country comes out on top.
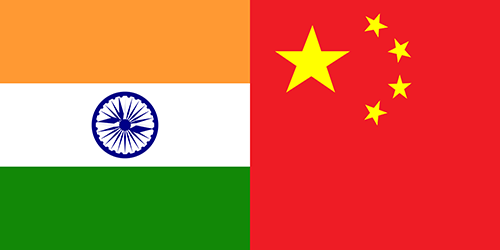
Compare the Top 10 causes of death and see which country comes out on top.
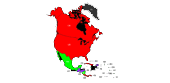
What happens when the Spain goes head to head with Mexico using only the top 10 causes of death? You will be surprised!
Compare the Top 10 causes of death and see which country comes out on top.
What happens when the USA goes head to head with Russia using only the top 10 causes of death? You will be surprised!
Compare the Top 10 causes of death and see which country comes out on top.

Compare the Top 10 causes of death and see which country comes out on top.
Compare the Top 10 causes of death and see which country comes out on top.

Compare the Top 10 causes of death and see which country comes out on top.
Compare the Top 10 causes of death and see which country comes out on top.
Compare the Top 10 causes of death and see which country comes out on top.
Compare the Top 10 causes of death and see which country comes out on top.
Compare the Top 10 causes of death and see which country comes out on top.
Compare the Top 10 causes of death and see which country comes out on top.
Compare the Top 10 causes of death and see which country comes out on top.

Compare the Top 10 causes of death and see which country comes out on top.